. 2009 Sep;297(3):R769-74.
doi: 10.1152/ajpregu.00131.2009. Epub 2009 Jul 8.

Cardiovascular changes during daily torpor in the laboratory mouse

Affiliations

Cardiovascular changes during daily torpor in the laboratory mouse

Steven J Swoap et al. Am J Physiol Regul Integr Comp Physiol. 2009 Sep.

Abstract

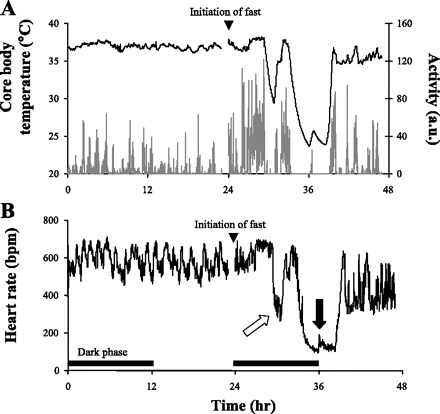
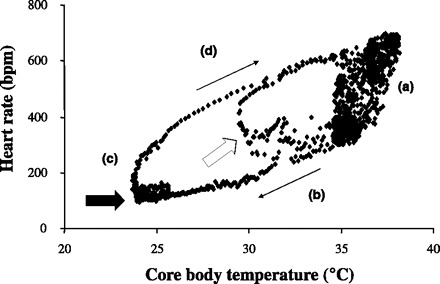
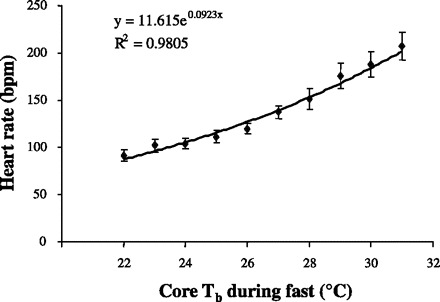
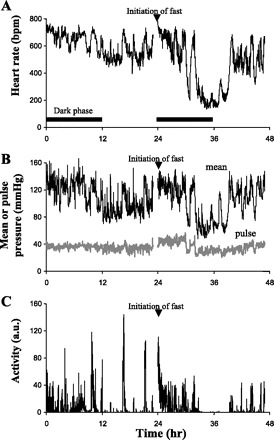
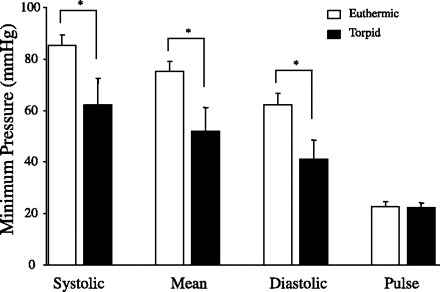
The laboratory mouse is a facultative daily heterotherm in that it experiences bouts of torpor under caloric restriction. Mice are the most frequently studied laboratory mammal, and often, genetically modified mice are used to investigate many physiological functions related to weight loss and caloric intake. As such, research documenting the cardiovascular changes during fasting-induced torpor in mice is warranted. In the current study, C57BL/6 mice were implanted either with EKG/temperature telemeters or blood pressure telemeters. Upon fasting and exposure to an ambient temperature (T(a)) of 19 degrees C, mice entered torpor bouts as assessed by core body temperature (T(b)). Core T(b) fell from 36.6 +/- 0.2 degrees C to a minimum of 25.9 +/- 0.9 degrees C during the fast, with a concomitant fall in heart rate from 607 +/- 12 beats per minute (bpm) to a minimum of 158 +/- 20 bpm. Below a core T(b) of 31 degrees C, heart rate fell exponentially with T(b), and the Q(10) was 2.61 +/- 0.18. Further, mice implanted with blood pressure telemeters exhibited similar heart rate and activity profiles as those implanted with EKG/temperature telemeters, and the fall in heart rate and core T(b) during entrance into torpor was paralleled by a fall in blood pressure. The minimum systolic, mean, and diastolic blood pressures of torpid mice were 62.3 +/- 10.2, 51.9 +/- 9.2, 41.0 +/- 7.5 mmHg, respectively. Torpid mice had a significantly lower heart rate (25-35%) than when euthermic at mean arterial pressures from 75 to 100 mmHg, suggesting that total peripheral resistance is elevated during torpor. These data provide new and significant insight into the cardiovascular adjustments that occur in torpid mice.


Figures

Fig. 1.
Fig. 1.
Typical core body temperature (Tb), activity, and heart rate response to fasting in a C57BL/6J female adult mouse. This mouse was implanted with a telemeter that detects core Tb (black line in A), activity (gray line in A), and electrical activity of the heart, from which heart rate was derived (B). The tracing spans 48 h, with the dark phases noted in B. Ambient temperature (Ta) was 19°C over both days. The mouse was fasted at the beginning of the dark phase of the second 24-h period. This mouse experienced a very shallow torpor bout ∼6 h after the initiation of the fast, as marked by the white arrow in B, and a much deeper bout a few hours later, as marked by the black arrow in part B.
Fig. 2.
Fig. 2.
Heart rate/core Tb relationship during torpor in the mouse. The data from the mouse shown in Fig. 1 are shown here. When heart rate is plotted as a function of core Tb, a complex relationship is observed with four different regions, labeled (a), (b), (c), and (d). Please see text for discussion of heart rate control in each of these regions. The white and black arrows correspond to the same arrows in B of Fig. 1. The thin arrows show the progression of the torpor bout in time.
Fig. 3.
Fig. 3.
The heart rate in torpid mice shows a strong core Tb dependence. Mice implanted with EKG/temperature telemeters were fasted. The average heart rate was calculated at Tbs between 22°C and 31°C. Heart rate showed a significant exponential relationship with core Tb, with a Q10 of 2.52 for the torpid mice.
Fig. 4.
Fig. 4.
Heart rate, mean arterial pressure, pulse pressure, and activity of a fasted mouse over a 23-h period. These typical tracings were obtained over 48 h from a C57BL/6J mouse implanted with a blood pressure telemeter. A: dark phases are shown. The mouse was fasted at the beginning of the dark phase on the second day. Ta was 19°C over both days. These tracings show a similar pattern of heart rate (A) and activity (C) as seen in Fig. 1. Mean arterial blood pressure (B) declines with both heart rate and inactivity. Minimum heart rate and minimum mean arterial pressure in this mouse was 135 bpm and 48 mmHg, respectively.
Fig. 5.
Fig. 5.
Minimum arterial pressures in the mouse over two 23-h periods. Mice were housed at a Ta of 19°C for 1 day while fed (euthermic, open bars). The following day, the mice were fasted and all entered bouts of torpor (torpid, solid bars). Minimum pulse pressure was not significantly different between the two states, whereas minimum systolic, mean, and diastolic arterial pressures were all significantly lower in the torpid state than the minimum pressures in the euthermic state. *P < 0.05 in euthermic vs. torpid.
Fig. 6.
Fig. 6.
Heart rate, mean arterial pressure, and an index of total peripheral resistance during a torpor bout. A: heart rate and mean arterial pressure data are shown from mice over two different 23-h periods: in a euthermic state and torpid state. Heart rate was calculated for each mouse in each condition over the mean blood pressure ranges shown. Mean blood pressure did not fall below 75 mmHg in the euthermic state. Mice in torpor displayed a significantly lower heart rate than the heart rate over the same mean arterial pressure range in euthermia. Data are expressed as means ± SE. *P < 0.05 vs. euthermic state. B: index of TPR is plotted over two 23-h periods for the same mouse. During “euthermia,” the mouse had access to food and water. The torpid trace corresponds to a fasted state (starting at time 0) and corresponds to the same data set shown in Fig. 4. Note the three-fold increase in the TPR index during torpor relative to the euthermic state. The TPR index was calculated using the equation: TPR = mean blood pressure / [heart rate × pulse pressure].

References

    1. Bouthegourd JC, Martin JC, Gripois D, Roseau S, Tome D, Even PC. Fat-depleted CLA-treated mice enter torpor after a short period of fasting. Appetite 42: 91–98, 2004 - PubMed
    1. Cannon B, Nedergard J. Brown adipose tissue: function and physiological significance. Physiol Rev 84: 277–359, 2004 - PubMed
    1. Cariou B, Bouchaert E, Abdelkarim M, Dumont J, Caron S, Fruchart JC, Burcelin R, Kuipers F, Staels B. FXR-deficiency confers increased susceptibility to torpor. FEBS Lett 581: 5191–5198, 2007 - PubMed
    1. Chatfield PO, Lyman CP. Circulatory changes during process of arousal in the hibernating hamster. Am J Physiol 163: 566–574, 1950 - PubMed
    1. Cranford JA. Body temperature, heart rate and oxygen consumption of normothermic and heterothermic Western jumping mice (Zapus princeps). Comp Biochem Physiol A 74: 595–599, 1983 - PubMed

Publication types