. 2009 Sep;297(3):C665-78.
doi: 10.1152/ajpcell.00200.2009. Epub 2009 Jul 8.

Metabolic inhibition increases activity of connexin-32 hemichannels permeable to Ca2+ in transfected HeLa cells

Affiliations

Metabolic inhibition increases activity of connexin-32 hemichannels permeable to Ca2+ in transfected HeLa cells

Helmuth A Sánchez et al. Am J Physiol Cell Physiol. 2009 Sep.

Abstract

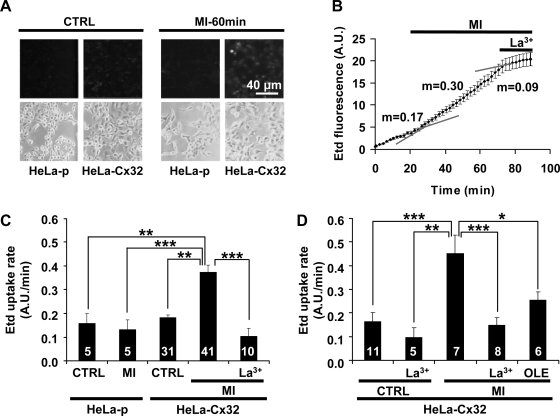
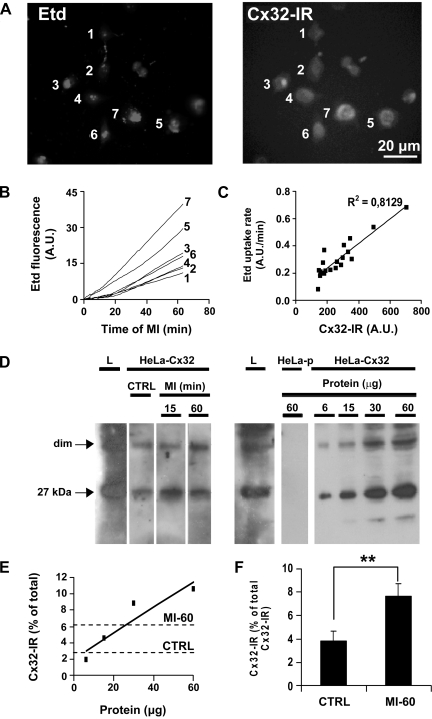
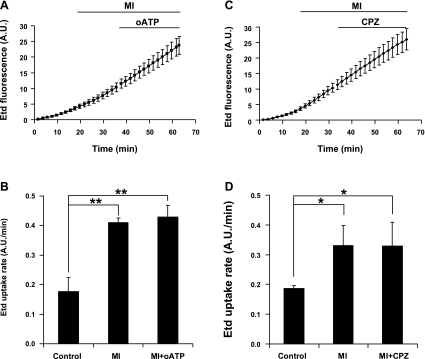
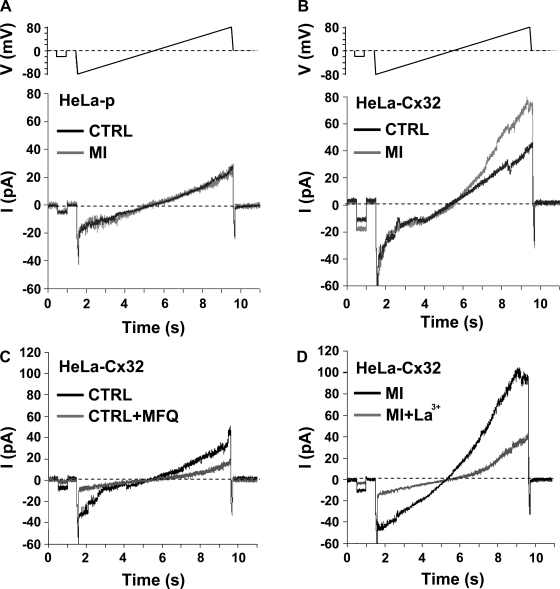
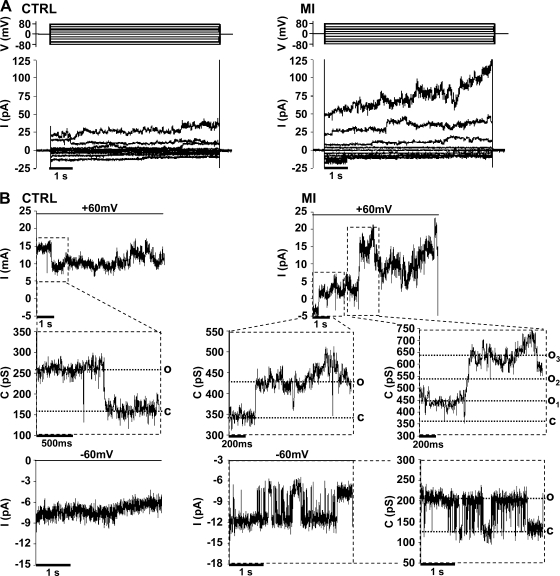
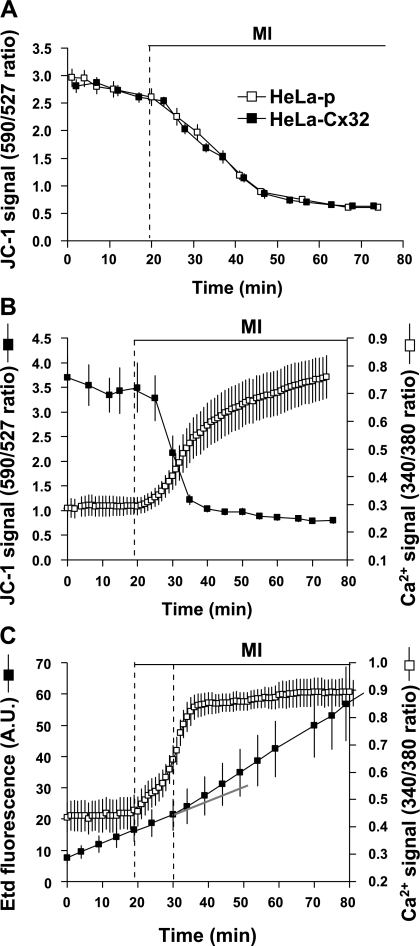
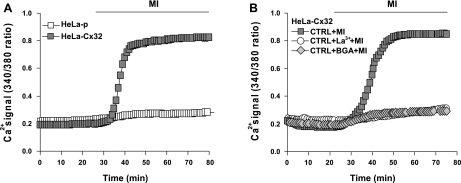
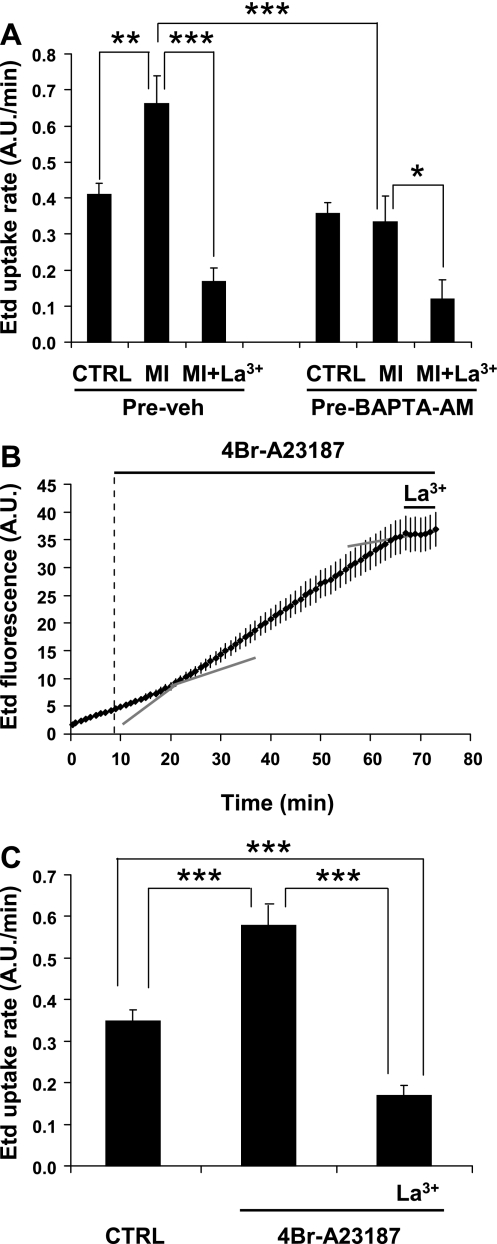
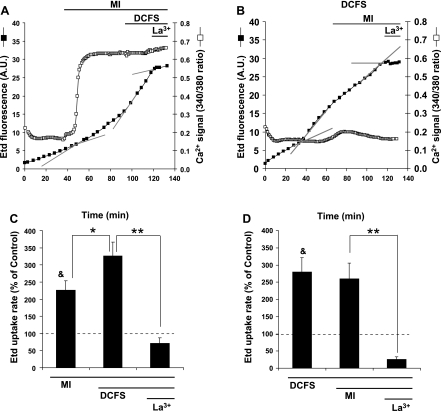
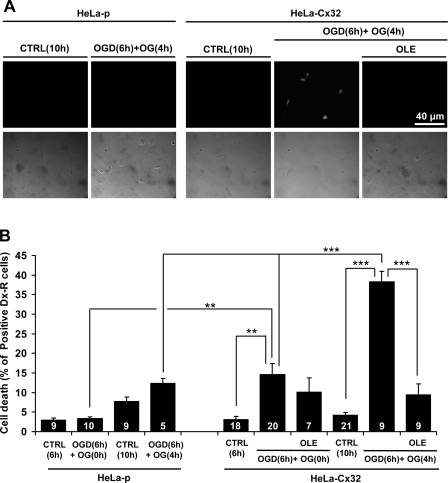
Numerous cell types express functional connexin (Cx) hemichannels (HCs), and membrane depolarization and/or exposure to a divalent cation-free bathing solution (DCFS) have been shown to promote HC opening. However, little is known about conditions that can promote HC opening in the absence of strong depolarization and when extracellular divalent cation concentrations remain at physiological levels. Here the effects of metabolic inhibition (MI), an in vitro model of ischemia, on the activity of mouse Cx32 HCs were examined. In HeLa cells stably transfected with mouse Cx32 (HeLa-Cx32), MI induced an increase in cellular permeability to ethidium (Etd). The increase in Etd uptake was directly related to an increase in levels of Cx32 HCs present at the cell surface. Moreover, MI increased membrane currents in HeLa-Cx32 cells. Underlying these currents were channels exhibiting a unitary conductance of approximately 90 pS, consistent with Cx32 HCs. These currents and Etd uptake were blocked by HC inhibitors. The increase in Cx32 HC activity was preceded by a rapid reduction in mitochondrial membrane potential and a rise in free intracellular Ca(2+) concentration ([Ca(2+)](i)). The increase in free [Ca(2+)](i) was prevented by HC blockade or exposure to extracellular DCFS and was virtually absent in parental HeLa cells. Moreover, inhibition of Cx32 HCs expressed by HeLa cells in low-confluence cultures drastically reduced cell death induced by oxygen-glucose deprivation, which is a more physiological model of ischemia-reperfusion. Thus HC blockade could reduce the increase in free [Ca(2+)](i) and cell death induced by ischemia-like conditions in cells expressing Cx32 HCs.


Figures

Fig. 1.
Fig. 1.
Metabolic inhibition enhances ethidium (Etd) uptake in HeLa cells transfected with connexin32 (HeLa-Cx32) but not in HeLa-parental (HeLa-p) cells. Fluorescent and corresponding bright-field images of cells exposed to 100 μM Etd for 2 min are shown. A: HeLa-p and HeLa-Cx32 cells under control conditions (Ctrl) or after 60 min of metabolic inhibition (MI-60min). B: representative plot of intensity of Etd fluorescence [in arbitrary units (AU)] over time. At the start of the experiment, 5 μM Etd was added to the bath. At ∼20 min, cells were exposed to MI, and at ∼70 min 100 μM La3+ was applied. Each point is the average ± SE fluorescence of 9 cells. Gray lines correspond to extrapolations of the linear regressions computed for each condition; m, rate of Etd uptake. C and D: rates of Etd uptake (5 μM) measured in low-confluence and subconfluent cultures of HeLa-p and HeLa-Cx32, respectively. Shown are rates of Etd uptake under control conditions (CTRL) or under MI, MI + 100 μM La3+ (La3+), or MI + 200 μM oleamide (OLE). Number of experiments is indicated in each column. Each experiment monitored fluorescence in 15 (C) and 25 (D) cells. Each bar indicates mean ± SE. *P < 0.05, **P < 0.01, ***P < 0.001, 1-way ANOVA with Newman-Keuls posttest.
Fig. 2.
Fig. 2.
Metabolic inhibition increases the number of hemichannels (HCs) at the surface of HeLa-Cx32 cells. HeLa-Cx32 cells were exposed to MI for ∼65 min in the presence of 10 μM Etd, and images were taken to evaluate dye uptake rate. The cells were then fixed and processed for Cx32 detection by immunofluorescence. A, left: Etd uptake induced by MI. Right: Cx32 immunoreactivity (Cx32-IR) in the same field shown on left. B: time lapse record showing Etd uptake over time in the cells (1–7) indicated in A. C: correlation analysis of rate of Etd uptake and level of Cx32-IR in cells under MI. Each point corresponds to Etd uptake and immunofluorescence measured in a single cell in a total of 3 separate experiments. D, left: immunoblot of Cx32 present in an aliquot of total rat liver homogenate (L; 50 μg of proteins) and at the cellular surface of subconfluent HeLa-Cx32 cells under control conditions (Ctrl) or exposed to MI for 15 or 60 min. In the last 3 lanes, surface proteins were biotinylated, precipitated, and subjected to immunoblot for Cx32. Right: samples of total HeLa-p homogenate and serial dilutions of total HeLa-Cx32 cell homogenates were analyzed by immunoblotting. L, aliquot of total liver homogenate used as a marker of the electrophoretic migration of the Cx32 monomer (27 kDa); dim indicates the mobility of the Cx32 dimer in the lanes loaded with a total liver homogenate aliquot for both panels. E: estimated amount of Cx32-forming HCs expressed as % of total amount of Cx32. Regression line was obtained from known quantities of proteins indicated in D. Percentages of Cx32-forming HCs under control conditions (Ctrl) or under MI for 60 min (MI-60) are indicated by dotted lines. F: results from 4 separate experiments. Each value is the average ± SE. **P < 0.01, t-test.
Fig. 3.
Fig. 3.
Etd uptake induced by MI is not blocked by either oxidized ATP or capsazepine in HeLa-Cx32 cells. A and C: representative plots obtained from time lapse experiments of Etd uptake in HeLa-Cx32 cells. Cells were maintained under control conditions for the first 15 min and then treated to induce MI. Oxidized ATP (oATP, 300 μM; A) or capsazepine (CPZ, 10 μM; C) was added ∼20 min after initiation of MI. Each point corresponds to the average ± SE of 16 (A) and 9 (C) cells. B and D: mean rates of Etd uptake obtained from experiments illustrated in A and C, respectively (n = 3 experiments). *P < 0.05, **P < 0.01, 1-way ANOVA with Newman-Keuls posttest.
Fig. 4.
Fig. 4.
HeLa-Cx32 cells exhibit macroscopic currents attributable to Cx32 HCs. Low-confluence cell cultures were used to record from single cells. Currents were obtained with whole cell patch-clamp recordings under control conditions (CTRL, black lines) and after exposure to MI (gray lines). Examples of membrane currents (I) recorded in HeLa-p cells (A) and in HeLa-Cx32 cells (B) are shown. The voltage (V) protocol (shown above current records) consisted of ramps applied from −80 to +80 mV, preceded by a −20 mV prepulse. HeLa-Cx32 cells showed larger currents after MI, particularly at positive voltages. C and D: HC blockers reduce currents attributable to Cx32 HCs under control conditions and MI. Current responses were evoked by applying voltage ramps as described in A and B. Shown is an example with mefloquine (MFQ, 15 μM), which reduced currents in a control HeLa-Cx32 cell (C, gray line), and La3+ (100 μM), which completely abolished the large increase in current observed after 60 min under MI (D, gray line).
Fig. 5.
Fig. 5.
MI enhances the activity but not the unitary conductance of Cx32-HCs. Membrane currents were measured in a whole cell voltage-clamp recording configuration using low-density cultures of HeLa-Cx32 cells under control conditions (CTRL) or under MI. Recordings were obtained ∼40 min after transfer of cells on coverslips from culture medium to the recording extracellular solution. A: representative current traces elicited by 10-s voltages steps from −80 to +80 mV, in 20-mV increments. B: views of unitary current events recorded at +60 and −60 mV taken from the current trace shown in A under control conditions and MI, respectively. Despite a high level of background noise in the whole cell configuration, unitary current transitions were identifiable and were converted on a point-by-point basis to conductance values (C) as indicated in the expanded region of the records. Unitary conductances of transitions recorded under control or MI conditions were ∼90 pS. Open (O) and closed (C) hemichannel states are indicated.
Fig. 6.
Fig. 6.
MI increases intracellular Ca2+ concentration ([Ca2+]i), which is inversely related to the decrease of mitochondrial membrane potential (Ψm) and precedes the increase in membrane permeability to Etd. A: representative plots of the fluorescence ratio (590 nm/527 nm) with the probe JC-1 obtained from HeLa-p and HeLa-Cx32 cells. This ratio reflects Ψm; a decrease in this ratio indicates a fall in Ψm. Dashed vertical line indicates the start of MI. B: time-lapse experiment showing changes in JC-1 and fura-2 fluorescence ratios to simultaneously monitor changes in Ψm and [Ca2+]i over time. Cells were maintained under control conditions for 20 min and then exposed to MI. Total recording time was 80 min. Dashed vertical line indicates the start of MI. C: time-lapse experiment showing Etd uptake simultaneously with changes in [Ca2+]i. As in B, MI was applied after 20 min in control conditions. First dashed vertical line indicates the start of MI, and second dashed vertical line indicates the time at which there was a change in the rate of Etd uptake after MI. Solid gray line is an extrapolation of the basal rate of Etd uptake under control conditions. Data points in B and C represent average ± SE fluorescence ratios obtained from 10 cells.
Fig. 7.
Fig. 7.
Increase in [Ca2+]i occurs with metabolic inhibition in HeLa-Cx32 but not HeLa-p cells and is prevented by HC blockers. A: representative plots of relative changes in [Ca2+]i over time during MI in HeLa-p cells (n = 11) and HeLa-Cx32 cells (n = 15). B: time course of relative change in [Ca2+]i in HeLa-Cx32 cells exposed to MI in the absence or presence of blockers. MI was induced after 20 min. HC blockers La3+ (100 μM) and 18β-glycyrrhetinic acid (BGA, 35 μM) were applied 10 min before induction of MI and maintained during the experiment. Each point represents the mean ± SE of 8 (CTRL+MI), 10 (CTRL+La3++MI), or 15 (CTRL+BGA+MI) cells.
Fig. 8.
Fig. 8.
BAPTA-AM, a chelator of intracellular free Ca2+, prevents the increase in Etd uptake induced by MI, whereas 4Br-A-23187, a Ca2+ ionophore, increases Etd uptake in HeLa-Cx32 cells. A: rates of Etd uptake measured in subconfluent HeLa-Cx32 cell cultures preincubated for 1 h with DMSO [0.01% (vol/vol), Pre-veh] or with BAPTA-AM (5 μM, Pre-BAPTA-AM). Each bar is the average ± SE of 5 experiments. In each experiment, 20 cells were analyzed. At the end of each experiment 100 μM La3+ (MI+La3+) was added. *P < 0.05, **P < 0.01, ***P < 0.001, 1-way ANOVA with Newman-Keuls posttest. B: representative plot of Etd uptake over time obtained from HeLa-Cx32 cells in a subconfluent culture. Cells were exposed to 4-Br-A-23187 (5 μM) (indicated by vertical dashed line) and then to La3+ (100 μM) as indicated. C: rates of Etd uptake; each bar is the average ± SE of 10 cells. ***P < 0.001, 1-way ANOVA with Newman-Keuls posttest.
Fig. 9.
Fig. 9.
MI induces Ca2+ entry from the extracellular space but does not induce opening of all Cx32 HCs. A: plots of Etd uptake and changes in [Ca2+]i simultaneously in response to MI followed by exposure to a divalent cation-free solution (DCFS) under MI. La3+ (100 μM) was applied after exposure to DCFS. B: plots of Etd uptake and changes in [Ca2+]i simultaneously in response to DCFS followed by exposure to MI in DFCS. La3+ (100 μM) was applied after exposure to MI. C: average rates of Etd uptake obtained under MI alone, MI followed by DCFS, and after addition of La3+. Each bar represents the average ± SE of 8 experiments. D: average rates of Etd uptake rates obtained on exposure to DCFS alone, DCFS followed by MI, and after addition of La3+. Each bar represents the average ± SE of 10 experiments. Each experiment in B and D includes analysis of 15 cells. *P < 0.05, **P < 0.01, 1-way ANOVA with Newman-Keuls posttest. &P < 0.05 with respect to control.
Fig. 10.
Fig. 10.
Necrosis induced by oxygen-glucose deprivation (OGD) in HeLa-Cx32 cells is prevented by oleamide. A: cultures of HeLa-p or HeLa-Cx32 cells were subjected to 6 h of OGD in the absence or presence of oleamide (Ole, 200 μM) applied 2 h before restoration of oxygen and glucose. Subsequently, cultures were exposed to solutions with glucose in the presence of ambient oxygen (OG) and incubated with dextran conjugated with rhodamine (Dex-Rd, 10 μM) for 5 min at time zero (0 h) or 4 h later (4 h) in the absence or presence of Ole (200 μM). The number of dead cells was quantified. Shown are examples of fluorescent (top) and corresponding bright-field (bottom) images taken under the conditions indicated. Cultures were kept under control conditions {saline solutions with glucose in presence of ambient oxygen for 6 h [CTRL (6h)] or 10 h [CTRL (10h)]}. B: % of cells stained with Dex-Rd (Dx-R, 10 μM) obtained in dissociated cultures of HeLa-p or HeLa-Cx32 cells. Each column represents the mean ± SE for the number of fields indicated, obtained from 5 independent experiments. **P < 0.01, ***P < 0.001, 1-way ANOVA with Newman-Keuls posttest.

Similar articles

Cited by

References

    1. Ankarcrona M, Dypbukt JM, Orrenius S, Nicotera P. Calcineurin and mitochondrial function in glutamate-induced neuronal cell death. FEBS Lett 394: 321–324, 1996 - PubMed
    1. Araya R, Riquelme MA, Brandan E, Sáez JC. The formation of skeletal muscle myotubes requires functional membrane receptors activated by extracellular ATP. Brain Res Rev 47: 174–188, 2004 - PubMed
    1. Arcuino G, Lin JH, Takano T, Liu C, Jiang L, Gao Q, Kang J, Nedergaard M. Intercellular calcium signaling mediated by point-source burst release of ATP. Proc Natl Acad Sci USA 99: 9840–9845, 2002 - PMC - PubMed
    1. Bano D, Nicotera P. Ca2+ signals and neuronal death in brain ischemia. Stroke 38: 674–676, 2007 - PubMed
    1. Bao X, Lee SC, Reuss L, Altenberg GA. Change in permeant size selectivity by phosphorylation of connexin 43 gap-junctional hemichannels by PKC. Proc Natl Acad Sci USA 104: 4919–4924, 2007 - PMC - PubMed

Publication types

LinkOut - more resources