

Fasting hyperglycemia is not associated with increased expression of PEPCK or G6Pc in patients with Type 2 Diabetes
- PMID: 19587243
- PMCID: PMC2707270
- DOI: 10.1073/pnas.0812547106
Fasting hyperglycemia is not associated with increased expression of PEPCK or G6Pc in patients with Type 2 Diabetes
Abstract
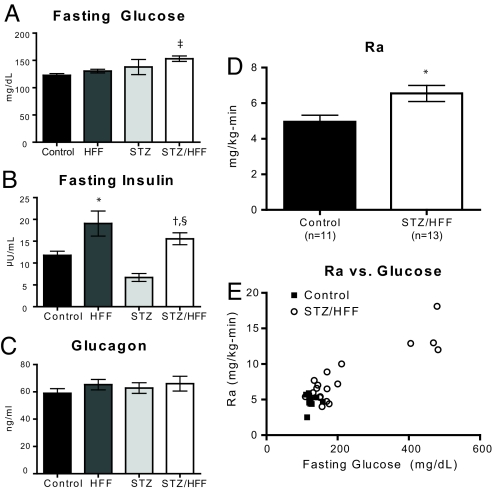
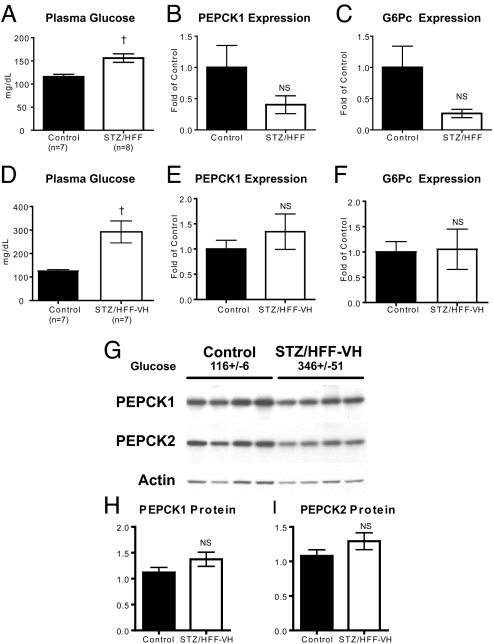
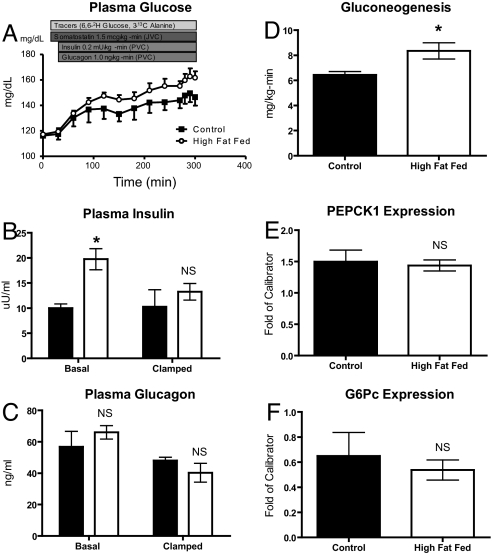
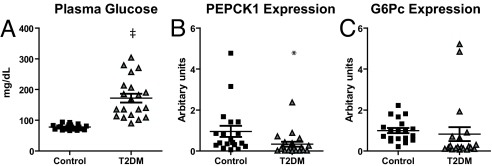
Fasting hyperglycemia in patients with type 2 diabetes mellitus (T2DM) is attributed to increased hepatic gluconeogenesis, which has been ascribed to increased transcriptional expression of phosphoenolpyruvate carboxykinase (PEPCK) and glucose-6-phosphatase, catalytic (G6Pc). To test this hypothesis, we examined hepatic expression of these 2 key gluconeogenic enzymes in 2 rodent models of fasting hyperglycemia and in patients with T2DM. In rats, high-fat feeding (HFF) induces insulin resistance but a robust beta-cell response prevents hyperglycemia. Fasting hyperglycemia was induced in the first rat model by using nicotinamide and streptozotocin to prevent beta-cell compensation, in combination with HFF (STZ/HFF). In a second model, control and HFF rats were infused with somatostatin, followed by portal vein infusion of insulin and glucagon. Finally, the expression of these enzymes was measured in liver biopsy samples obtained from insulin sensitive, insulin resistant, and untreated T2DM patients undergoing bariatric surgery. Rats treated with STZ/HFF developed modest fasting hyperglycemia (119 +/- 4 vs. 153 +/- 6 mg/dL, P < 0.001) and increased rates of endogenous glucose production (EGP) (4.6 +/- 0.6 vs. 6.9 +/- 0.6 mg/kg/min, P = 0.02). Surprisingly, the expression of PEPCK or G6Pc was not increased. Matching plasma insulin and glucagon with portal infusions led to higher plasma glucoses in the HFF rats (147 +/- 4 vs. 161 +/- 4 mg/dL, P = 0.05) with higher rates of EGP and gluconeogenesis. However, PEPCK and G6Pc expression remained unchanged. Finally, in patients with T2DM, hepatic expression of PEPCK or G6Pc was not increased. Thus, in contrast to current dogma, these data demonstrate that increased transcriptional expression of PEPCK1 and G6Pc does not account for increased gluconeogenesis and fasting hyperglycemia in patients with T2DM.
Conflict of interest statement
The authors declare no conflict of interest.
Figures
References
-
- Maggs DG, et al. Metabolic effects of troglitazone monotherapy in type 2 diabetes mellitus. A randomized, double-blind, placebo-controlled trial. Ann Intern Med. 1998;128:176–185. - PubMed
-
- Gastaldelli A, et al. Separate contribution of diabetes, total fat mass, and fat topography to glucose production, gluconeogenesis, and glycogenolysis. J Clin Endocrinol Metab. 2004;89:3914–3921. - PubMed
-
- Wajngot A, et al. Quantitative contributions of gluconeogenesis to glucose production during fasting in type 2 diabetes mellitus. Metabolism. 2001;50(1):47–52. - PubMed
Publication types
MeSH terms
Substances
Grants and funding
LinkOut - more resources
Full Text Sources
Other Literature Sources
Medical
