

Minute effects of sex on the aging brain: a multisample magnetic resonance imaging study of healthy aging and Alzheimer's disease
- PMID: 19587284
- PMCID: PMC2782778
- DOI: 10.1523/JNEUROSCI.0115-09.2009
Minute effects of sex on the aging brain: a multisample magnetic resonance imaging study of healthy aging and Alzheimer's disease
Abstract
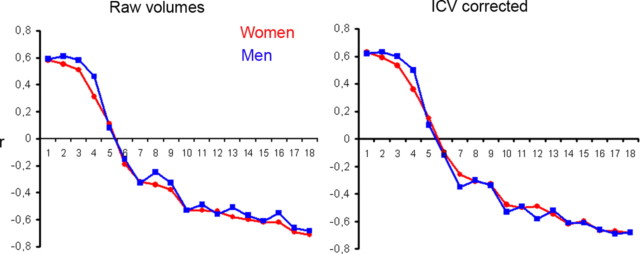
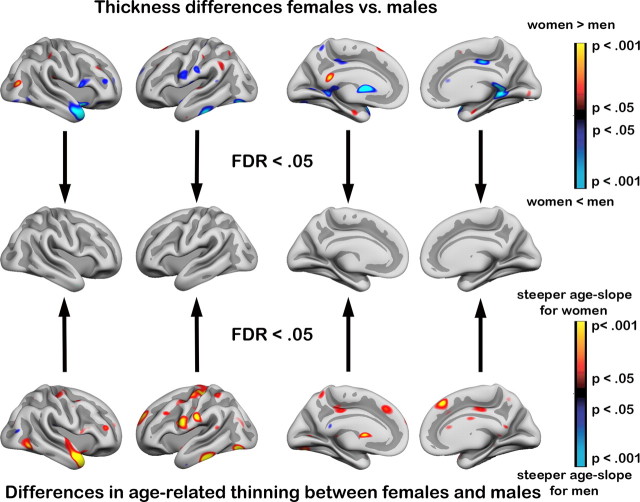
Age is associated with substantial macrostructural brain changes. While some recent magnetic resonance imaging studies have reported larger age effects in men than women, others find no sex differences. As brain morphometry is a potentially important tool in diagnosis and monitoring of age-related neurological diseases, e.g., Alzheimer's disease (AD), it is important to know whether sex influences brain aging. We analyzed cross-sectional magnetic resonance scans from 1143 healthy participants from seven subsamples provided by four independent research groups. In addition, 96 patients with mild AD were included. Estimates of cortical thickness continuously across the brain surface, as well as volume of 17 subcortical structures, were obtained by use of automated segmentation tools (FreeSurfer). In the healthy participants, no differences in aging slopes between women and men were found in any part of the cortex. Pallidum corrected for intracranial volume showed slightly higher age correlations for men. The analyses were repeated in each of the seven subsamples, and the lack of age x sex interactions was largely replicated. Analyses of the AD sample showed no interactions between sex and age for any brain region. We conclude that sex has negligible effects on the age slope of brain volumes both in healthy participants and in AD.
Figures


References
-
- Allen JS, Bruss J, Brown CK, Damasio H. Normal neuroanatomical variation due to age: the major lobes and a parcellation of the temporal region. Neurobiol Aging. 2005;26:1245–1260. discussion 1279–1282. - PubMed
-
- Auer S, Reisberg B. The GDS/FAST staging system. Int Psychogeriatr. 1997;9(Suppl 1):167–171. - PubMed
-
- Beck AT, Steer RA, Brown GK. New York: The Psychological Corporation; 1987. Beck depression inventory scoring manual.
-
- Berg L. Clinical Dementia Rating. Br J Psychiatry. 1984;145:339. - PubMed
-
- Berg L. Clinical Dementia Rating (CDR) Psychopharmacol Bull. 1988;24:637–639. - PubMed
Publication types
MeSH terms
Grants and funding
- U24 RR021382/RR/NCRR NIH HHS/United States
- P50 AG05681/AG/NIA NIH HHS/United States
- R01-RR13609/RR/NCRR NIH HHS/United States
- R01EB006758/EB/NIBIB NIH HHS/United States
- R01 NS052585-01/NS/NINDS NIH HHS/United States
- R01 EB001550/EB/NIBIB NIH HHS/United States
- R01 NS052585/NS/NINDS NIH HHS/United States
- R01 RR16594-01A1/RR/NCRR NIH HHS/United States
- R01-NS39581/NS/NINDS NIH HHS/United States
- R01 EB006758/EB/NIBIB NIH HHS/United States
- R37-AG11230/AG/NIA NIH HHS/United States
- P41-RR14075/RR/NCRR NIH HHS/United States
- P20 MH071616/MH/NIMH NIH HHS/United States
- HHMI/Howard Hughes Medical Institute/United States
- U54 EB005149/EB/NIBIB NIH HHS/United States
- P01 AG003991/AG/NIA NIH HHS/United States
- P50 AG005681/AG/NIA NIH HHS/United States
- P01 AG03991/AG/NIA NIH HHS/United States
- P41 RR014075/RR/NCRR NIH HHS/United States
- R37 AG011230/AG/NIA NIH HHS/United States
- RR 16594/RR/NCRR NIH HHS/United States
- R01 AG034556/AG/NIA NIH HHS/United States
- R01 RR016594/RR/NCRR NIH HHS/United States
- RR14075/RR/NCRR NIH HHS/United States
- P50 MH071616/MH/NIMH NIH HHS/United States
LinkOut - more resources
Full Text Sources
Medical
Research Materials