Comparative Study
. 2009 Jul 8;29(27):8847-57.
doi: 10.1523/JNEUROSCI.0689-09.2009.

Postnatal expression pattern of HCN channel isoforms in thalamic neurons: relationship to maturation of thalamocortical oscillations

Affiliations
Comparative Study

Postnatal expression pattern of HCN channel isoforms in thalamic neurons: relationship to maturation of thalamocortical oscillations

Tatyana Kanyshkova et al. J Neurosci. .

Abstract

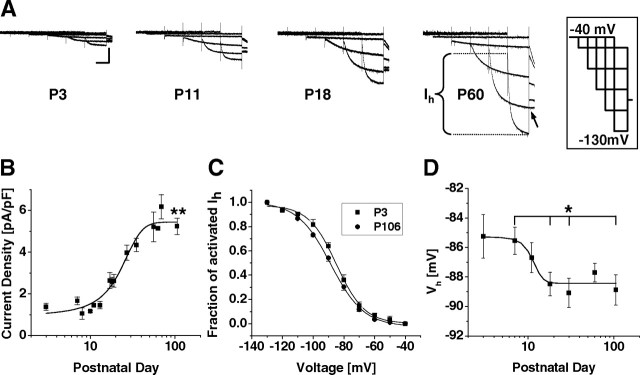
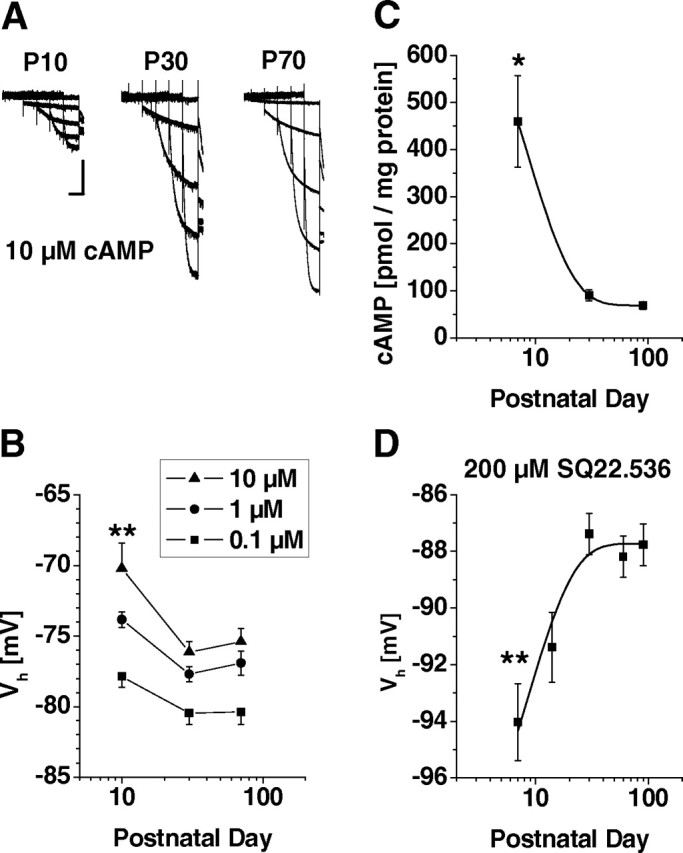
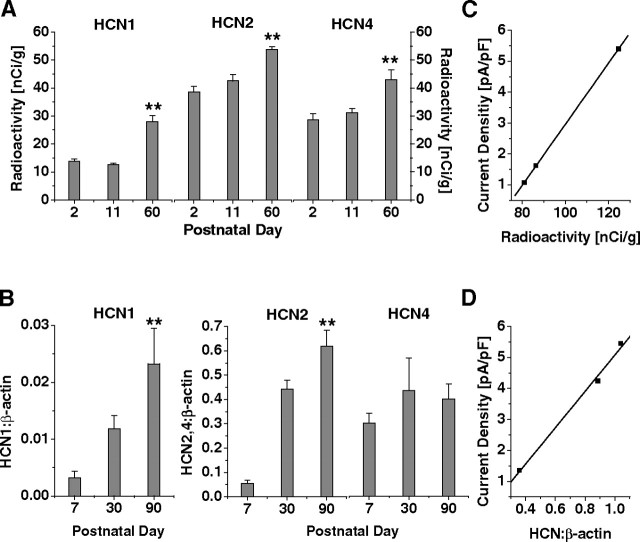
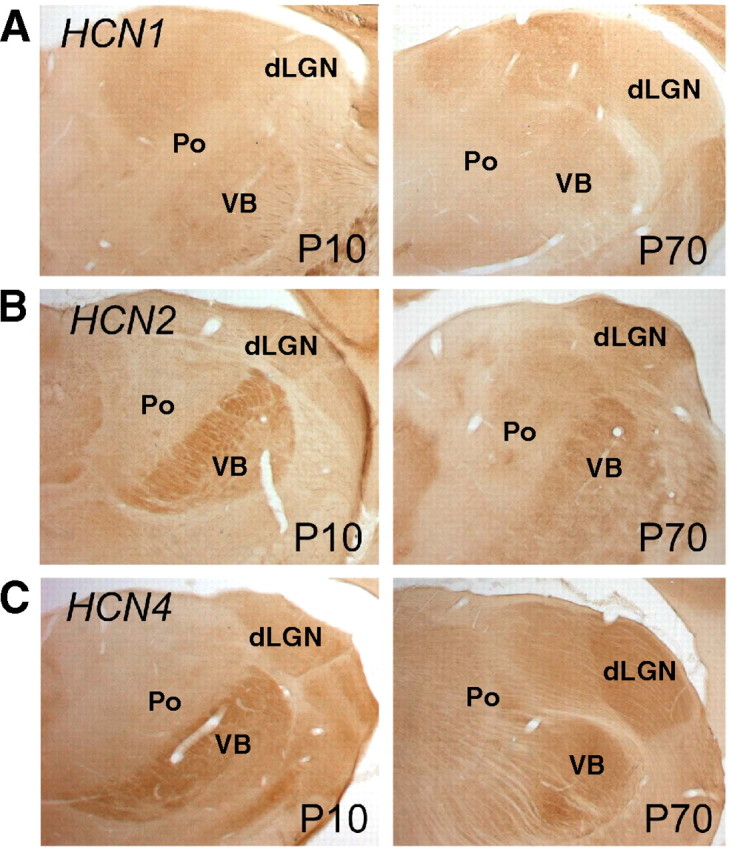
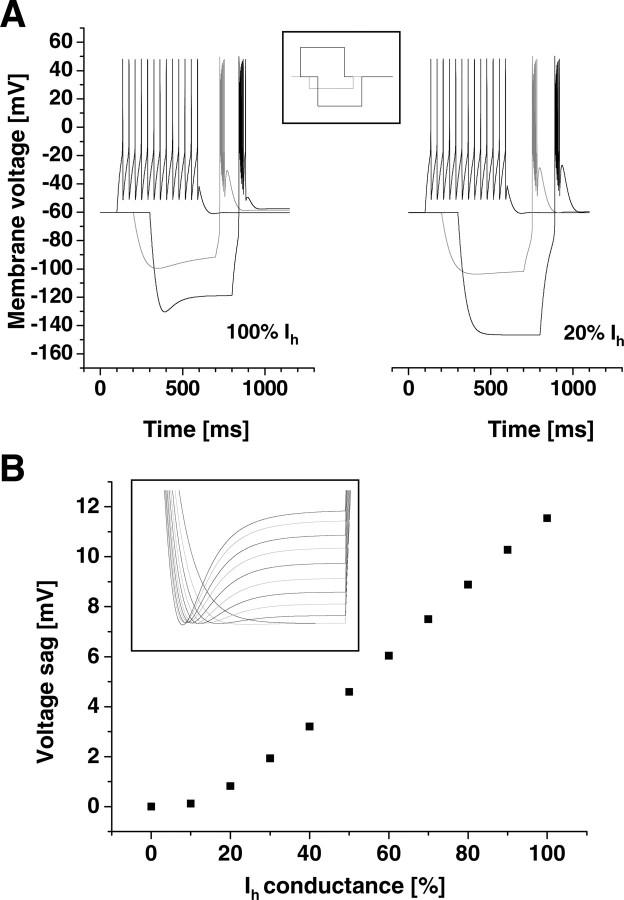
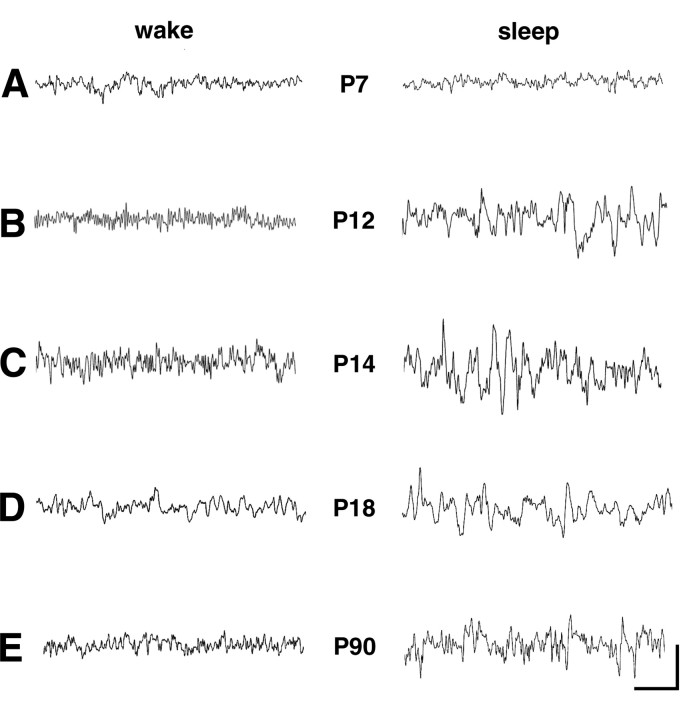
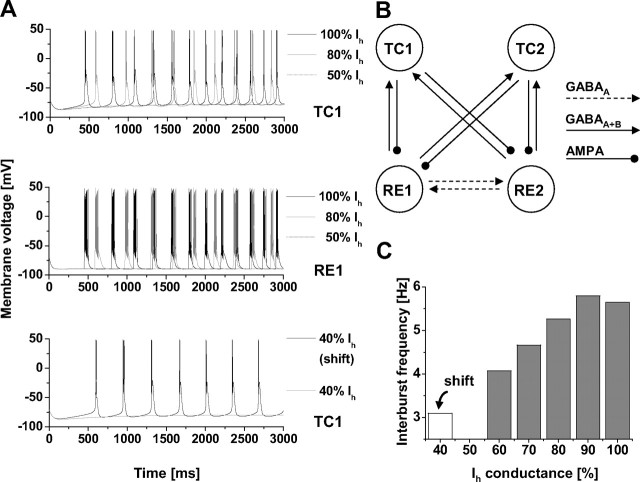
Hyperpolarization-activated cyclic nucleotide-gated cation (HCN) channels are the molecular substrate of the hyperpolarization-activated inward current (I(h)). Because the developmental profile of HCN channels in the thalamus is not well understood, we combined electrophysiological, molecular, immunohistochemical, EEG recordings in vivo, and computer modeling techniques to examine HCN gene expression and I(h) properties in rat thalamocortical relay (TC) neurons in the dorsal part of the lateral geniculate nucleus and the functional consequence of this maturation. Recordings of TC neurons revealed an approximate sixfold increase in I(h) density between postnatal day 3 (P3) and P106, which was accompanied by significantly altered current kinetics, cAMP sensitivity, and steady-state activation properties. Quantification on tissue levels revealed a significant developmental decrease in cAMP. Consequently the block of basal adenylyl cyclase activity was accompanied by a hyperpolarizing shift of the I(h) activation curve in young but not adult rats. Quantitative analyses of HCN channel isoforms revealed a steady increase of mRNA and protein expression levels of HCN1, HCN2, and HCN4 with reduced relative abundance of HCN4. Computer modeling in a simplified thalamic network indicated that the occurrence of rhythmic delta activity, which was present in the EEG at P12, differentially depended on I(h) conductance and modulation by cAMP at different developmental states. These data indicate that the developmental increase in I(h) density results from increased expression of three HCN channel isoforms and that isoform composition and intracellular cAMP levels interact in determining I(h) properties to enable progressive maturation of rhythmic slow-wave sleep activity patterns.


Figures

Figure 1.
Figure 1.
Postnatal development of Ih properties in TC neurons. A, Representative current traces obtained from cells of different postnatal age. Currents were elicited by applying the shown voltage-clamp protocol from −40 mV (inset). The tail current voltage was −100 mV (see arrow). The duration of each hyperpolarizing step was shortened as command potentials became more negative. Calibration: 3 s, 100 pA. The bracket indicates the amplitude of Ih. B, Mean current density versus postnatal age reveals increasing Ih currents (n = 63; 1–8 per data point). Current densities were calculated by dividing amplitudes at −130 mV by the membrane capacitance obtained during whole-cell recordings. Data from P3 and P106 cells were highly significantly different (**p < 0.01). C, Mean steady-state activation curves for P3 and P106 were obtained by plotting normalized tail current amplitudes against the step potential and fitting them with a Boltzmann function. D, Mean half-maximal activation voltages (Vh) versus postnatal age reveals a hyperpolarizing shift in Vh with age (n = 6–17 per data point). Significantly different results were obtained for some combinations of postnatal ages (see Results) (*p < 0.05).
Figure 2.
Figure 2.
Modulation of Ih by cAMP. A, Representative current traces obtained from cells in the presence of 10 μm intracellular cAMP at P10, P30, and P70. Voltage protocols as in Figure 1. Calibration: 3 s, 200 pA. B, Mean Vh values of steady-state activation curves at different postnatal ages (P10, P30, and P70) in the presence of 0.1 μm (filled squares), 1 μm (filled circles), and 10 μm (filled triangles) of intracellular cAMP were obtained from independent populations of cells. Data from P7 and P70 cells were highly significantly different (**p < 0.01). C, Results obtained from a radioactive competition assay revealed a significant decrease in cAMP content with age (*p < 0.05). D, Mean Vh values of steady-state activation curves at different postnatal ages (P7, P14, P30, P60, and P90) after preincubation of brain slices in SQ22.536 (200 μm, 2 h). Results indicated a highly significant hyperpolarization at P7 compared with age-matched controls (**p < 0.01).
Figure 3.
Figure 3.
Quantitative analyses of postnatal mRNA and protein expression of HCN channels. A, HCN1, HCN2, and HCN4 mRNA levels in dLGN were obtained using radioactively labeled in situ hybridization probes (n = 3–6 per group). Significance is indicated for the comparison of P2 and P60 (**p < 0.01). B, HCN1, HCN2, and HCN4 protein levels in dLGN were evaluated using Western blot procedures with β-actin as reference (n = 9 per group). Significance is indicated for the comparison of P7 and P90 (**p < 0.01). C, Relationship between Ih current density and radioactive ISH signals. Values of radioactivity were summed for P2, P11, and P60 and plotted versus age-matched current density values from the fit in Figure 1B. D, Relationship between Ih current density and normalized Western blot signals. Values of HCN/β-actin ratios were summed for P7, P30, and P90 and plotted versus age-matched current density values from the fit in Figure 1B.
Figure 4.
Figure 4.
Immunohistochemical characterization of HCN channel localization. Specific antibodies directed against HCN1 (A), HCN2 (B), and HCN4 (C) were applied. All isoforms were detected in the dLGN and immunoreactivity was stronger in adult (P70) compared with P10 animals, which is consistent with the results of the mRNA and protein analysis (see Fig. 3). In both P10 and P70 dLGN, HCN1 immunoreactivity was considerably weaker than the corresponding immunosignal of the HCN2 and HCN4 isoforms. This may reflect the generally lower expression levels of HCN1 compared with these isoforms (see Fig. 3). Po, Posterior thalamic nuclear group; VB, ventrobasal thalamic complex.
Figure 5.
Figure 5.
Single-cell modeling. A, Reducing Ih affects burst behavior. Although there is no significant difference in the tonic action potential generation, reducing the maximum Ih conductance from 100% (left) to 20% (right) affects the response of the model to hyperpolarization. The applied stimulus protocol is given in the inset. B, Incrementing the maximum Ih conductance of the single-cell TC neuron model in 10% steps from 0 to 100% led to a linearly growing voltage sag. The voltage sag was determined by subtracting the initial (global minimum) from the final (right at the end of the stimulus) membrane voltage (see inset).
Figure 6.
Figure 6.
In vivo cortical EEGs demonstrating the development of slow-wave sleep patterns with age. At each age, traces from the wake state (assessed via concurrent video monitoring) are on the left, whereas sleep traces are on the right. Traces obtained on P7 (A), P12 (B), P14 (C), P18 (D), and P90 (E) are shown. A, There was little distinction between the frequency distribution of EEG rhythms in the wake and the sleep state at P7. B, By P12, initial irregular slow-wave oscillations (2–4 Hz) were apparent in NREM sleep recordings, readily distinguishable from the wake record. C–E, Similar, maturing sleep patterns were found in EEG at older ages (C, D), leading to the well developed delta frequency (1–2 Hz) NREM sleep waves in the adult (E). Calibration: 1 s, 50 μV (P7), 0.1 mV (P12 and P14), 0.5 mV (P18), and 1 mV (P90).
Figure 7.
Figure 7.
Network modeling. A, Results in both TC and RE neurons were identical. Therefore, only TC1 (top) and RE1 (middle) are shown. Oscillations disappear while reducing Ih. Given 100% Ih (black traces), the network shows oscillations at 5.6 Hz. By simultaneously reducing the maximum Ih conductance of both TC cells to 80% (gray traces), the oscillations are decelerated to 5.3 Hz and finally disappear if the Ih level is set to 50% (dashed traces). With Ih levels set to 40% (bottom), a 15 mV depolarizing shift in the activation curve resulted in resuming of oscillatory activity. B, The network topology as well as the connection parameters corresponds to Destexhe et al. (1996). RE neurons reciprocally communicate via GABAA-mediated connections and project to both TC neurons via GABAA and GABAB. The feedback from TC cells is carried by AMPA receptors in both RE cells. C, Interburst frequency. Stepwise reducing the maximum Ih conductance in both TC cells of the network continuously slowed down the oscillations and finally erased all suprathreshold activity in case the Ih level falls to 50%. The interburst frequency was calculated with regard to the tip of the first action potentials of two consecutive bursts. All calculations were based on the traces of TC1 and considered the last seven bursts in each simulation for determining the plotted mean frequency. The arrow indicates the interburst frequency with 40% Ih and a 15 mV shift in the activation curve.

References

    1. Bender RA, Baram TZ. HCN channels in developing neuronal networks. Prog Neurobiol. 2008;86:129–140. - PMC - PubMed
    1. Bender RA, Brewster A, Santoro B, Ludwig A, Hofmann F, Biel M, Baram TZ. Differential and age-dependent expression of hyperpolarization-activated, cyclic nucleotide-gated cation channel isoforms 1–4 suggests evolving roles in the developing rat hippocampus. Neuroscience. 2001;106:689–698. - PMC - PubMed
    1. Bender RA, Soleymani SV, Brewster AL, Nguyen ST, Beck H, Mathern GW, Baram TZ. Enhanced expression of a specific hyperpolarization-activated cyclic nucleotide-gated cation channel (HCN) in surviving dentate gyrus granule cells of human and experimental epileptic hippocampus. J Neurosci. 2003;23:6826–6836. - PMC - PubMed
    1. Blumberg MS, Karlsson KA, Seelke AM, Mohns EJ. The ontogeny of mammalian sleep: a response to Frank and Heller (2003) J Sleep Res. 2005;14:91–98. - PMC - PubMed
    1. Brewster A, Bender RA, Chen Y, Dube C, Eghbal-Ahmadi M, Baram TZ. Developmental febrile seizures modulate hippocampal gene expression of hyperpolarization-activated channels in an isoform- and cell-specific manner. J Neurosci. 2002;22:4591–4599. - PMC - PubMed

Publication types

MeSH terms