. 2009 Sep;58(9):2109-18.
doi: 10.2337/db08-0895. Epub 2009 Jul 8.

Effect of the monocyte chemoattractant protein-1/CC chemokine receptor 2 system on nephrin expression in streptozotocin-treated mice and human cultured podocytes

Affiliations

Effect of the monocyte chemoattractant protein-1/CC chemokine receptor 2 system on nephrin expression in streptozotocin-treated mice and human cultured podocytes

Elena Tarabra et al. Diabetes. 2009 Sep.

Abstract

Objective: Monocyte chemoattractant protein-1 (MCP-1), a chemokine binding to the CC chemokine receptor 2 (CCR2) and promoting monocyte infiltration, has been implicated in the pathogenesis of diabetic nephropathy. To assess the potential relevance of the MCP-1/CCR2 system in the pathogenesis of diabetic proteinuria, we studied in vitro if MCP-1 binding to the CCR2 receptor modulates nephrin expression in cultured podocytes. Moreover, we investigated in vivo if glomerular CCR2 expression is altered in kidney biopsies from patients with diabetic nephropathy and whether lack of MCP-1 affects proteinuria and expression of nephrin in experimental diabetes.

Research design and methods: Expression of nephrin was assessed in human podocytes exposed to rh-MCP-1 by immunofluorescence and real-time PCR. Glomerular CCR2 expression was studied in 10 kidney sections from patients with overt nephropathy and eight control subjects by immunohistochemistry. Both wild-type and MCP-1 knockout mice were made diabetic with streptozotocin. Ten weeks after the onset of diabetes, albuminuria and expression of nephrin, synaptopodin, and zonula occludens-1 were examined by immunofluorescence and immunoblotting.

Results: In human podocytes, MCP-1 binding to the CCR2 receptor induced a significant reduction in nephrin both mRNA and protein expression via a Rho-dependent mechanism. The MCP-1 receptor, CCR2, was overexpressed in the glomerular podocytes of patients with overt nephropathy. In experimental diabetes, MCP-1 was overexpressed within the glomeruli and the absence of MCP-1 reduced both albuminuria and downregulation of nephrin and synaptopodin.

Conclusions: These findings suggest that the MCP-1/CCR2 system may be relevant in the pathogenesis of proteinuria in diabetes.


Figures

FIG. 1.
FIG. 1.
The CCR2 receptor is expressed by human podocytes. CCR2 protein expression was studied in human cultured podocytes by immunoblotting as described in research design and methods. Total proteins were separated by SDS gel electrophoresis, transferred to nitrocellulose membranes, and probed for the CCR2 receptor by immunoblotting using a rabbit anti-human CCR2 antibody. A representative immunoblot is shown of the specific band for CCR2 at ∼42 kDa. NC: negative control obtained by omitting the primary antibody. PC: positive control of total protein extracts from the monocyte cell line THP-1. PODO: total protein extracts from human podocytes.
FIG. 2.
FIG. 2.
MCP-1 reduces nephrin mRNA and protein expression via a CCR2-Rho-dependent mechanism in cultured human podocytes. A: Nephrin mRNA levels measured by real-time PCR in podocytes exposed to either vehicle or rh-MCP-1 (10 ng/ml) for 2 and 4 h. Results were corrected for the expression of the housekeeping gene glyceraldehydes-3-phosphate dehydrogenase and expressed as percentage decrease as compared with control subjects (n = 3, *P < 0.01 rh-MCP-1 at 2 h vs. control subjects). B: Podocytes were exposed to rh-MCP-1 (10 ng/ml) for 2, 4, 6, 12, and 24 h and (C) to rh-MCP-1 (0.1–1 to 10–100 ng/ml) for 4 h. Nephrin expression, assessed by immunofluorescence, was expressed as percentage change in RFI as compared with control subjects (n = 3 *P < 0.01 rh-MCP-1 at 2, 12, and 24 h over control subjects [□]; †P < 0.001 rh-MCP-1 at 4 and 6 h over control subjects; ‡P < 0.05 rh-MCP-1 at 1 ng/ml over control subjects; §P < 0.001 rh-MCP-1 at 10 ng/ml over control subjects). Representative immunofluorescence images are shown in D (vehicle) and E (rh-MCP-1 at 10 ng/ml for 4 h). Magnification ×400. F: Podocytes were exposed to MCP-1 (10 ng/ml) for 0, 10, 30, 60, 120, and 180 min (upper panel) and 10 min in the absence and/or in the presence of Y27632 (Y27 10 μmol/l), a specific ROCK inhibitor (lower panel). Both total and phosphorylayed MYPT1 were assessed by immunoblotting on total protein extracts. Representative blottings are shown. G: Podocytes were exposed to rh-MCP-1 (10 ng/ml) in the presence and in the absence of RS102895 (RS 6 μmol/l), a CCR2 receptor antagonist, and Y27632 (Y27 10 μmol/l), a specific ROCK inhibitor, added 60 min before rh-MCP-1. After 2 h incubation, nephrin mRNA levels were measured by real-time PCR, corrected for the expression of the housekeeping gene glyceraldehydes-3-phosphate dehydrogenase, and expressed as percentage change over control (n = 3, *P < 0.05 rh-MCP-1 vs. others). H: At 4 h, nephrin protein expression was assessed by indirect immunofluorescence using a low-light video camera and expressed as percentage change in RFI as compared to control subjects (n = 3; *P < 0.05 rh-MCP-1 vs. others).
FIG. 3.
FIG. 3.
MCP-1 effect on synaptopodin expression in cultured human podocytes. Podocytes were exposed either to rh-MCP-1 (10 ng/ml) (A) or vehicle (B) for 4 h, then synaptopodin expression assessed by immunofluorescence. Representative immunofluorescence images are shown (magnification ×800). C: Results were expressed as percentage change in RFI as compared with control subjects (n = 3 *NS rh-MCP-1 vs. control subjects). (A high-quality digital representation of this figure is available in the online issue.)
FIG. 4.
FIG. 4.
CCR2 staining of human glomeruli from control subjects and patients with diabetic nephropathy. CCR2 protein expression was evaluated in human glomeruli from control subjects (A and D) and diabetic patients with overt nephropathy (B and E) by immunohistochemistry as described in research design and methods. C: Nonspecific staining was determined by preabsorbing the anti-CCR2 antibody with a 10-fold excess of control peptide. F: Double immunofluorescence for CCR2 (F) and (G) the podocyte marker synaptopodin performed on the diabetic glomeruli showed colocalisation of the positive staining, as demonstrated by merging (H). Magnification ×400 (×80 D and E). Arrows and arrowhead indicate podocytes and mesangial cells, respectively. (A high-quality digital representation of this figure is available in the online issue.)
FIG. 5.
FIG. 5.
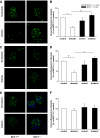
Glomerular staining for nephrin, synaptopodin, and ZO-1 in diabetic wild-type and MCP-1 knockout mice. Kidney paraffin sections from both diabetic and nondiabetic MCP-1+/+ and MCP-1−/− mice were stained for nephrin, synaptopodin, and ZO-1 by immunofluorescence as described in research design and methods. B, D, and F: Quantification of glomerular staining for nephrin (*P < 0.01 diabetic MCP-1+/+ vs. nondiabetic MCP-1+/+ mice; †P < 0.001 diabetic MCP-1−/− vs. diabetic MCP-1+/+ mice), synaptopodin (*P < 0.01 diabetic MCP-1−/− vs. diabetic MCP-1+/+ mice; †P < 0.05 diabetic MCP-1+/+ vs. nondiabetic MCP-1+/+ mice), and ZO-1 (P = NS). A, C, and E: Representative figures of nephrin, synaptopodin, and ZO-1 glomerular staining. Magnification ×400. (A high-quality digital representation of this figure is available in the online issue.)
FIG. 6.
FIG. 6.
Nephrin, synaptopodin, and ZO-1 expression in the renal cortex from diabetic wild-type and MCP-1 knockout mice. Nephrin (A), synaptopodin (B), and ZO-1 (C) expression was studied in renal cortex from both diabetic and nondiabetic MCP-1+/+ and MCP-1−/− mice by immunoblotting as described in research design and methods. Densitometry analysis and representative immunoblots are shown. *P < 0.05 diabetic versus others.
FIG. 7.
FIG. 7.
Morphology of podocyte foot process (transmission electron microscopy, ×7,000) in nondiabetic MCP-1+/+ (A), diabetic MCP-1+/+ (B), diabetic MCP-1−/− (C), and nondiabetic MCP-1−/− (D) mice 10 weeks after the onset of STZ-induced diabetes.

References

    1. Molitch ME, DeFronzo RA, Franz MJ, Keane WF, Mogensen CE, Parving HH, Steffes MW: the American Diabetes Association. Nephropathy in diabetes. Diabetes Care 2004; 27: S79– S83 - PubMed
    1. Li JJ, Kwak SJ, Jung DS, Kim JJ, Yoo TH, Ryu DR, Han SH, Choi HY, Lee JE, Moon SJ, Kim DK, Han DS, Kang SW: Podocyte biology in diabetic nephropathy. Kidney Int 2007; 106: S36– S42 - PubMed
    1. Wolf G, Chen S, Ziyadeh FN: From the periphery of the glomerular capillary wall toward the center of disease: podocyte injury comes of age in diabetic nephropathy. Diabetes 2005; 54: 1626– 1634 - PubMed
    1. Pavenstadt H, Kriz W, Kretzler M: Cell biology of the glomerular podocyte. Physiol Rev 2003; 83: 253– 307 - PubMed
    1. Kestila M, Lenkkeri U, Mannikko M, Lamerdin J, McCready P, Putaala H, Ruotsalainen V, Morita T, Nissinen M, Herva R, Kashtan CE, Peltonen L, Holmberg C, Olsen A, Tryggvason K: Positionally cloned gene for a novel glomerular protein—nephrin—is mutated in congenital nephrotic syndrome. Mol Cell 1998; 1: 575– 582 - PubMed

Publication types

MeSH terms