

Vasohibin-1, a negative feedback regulator of angiogenesis, ameliorates renal alterations in a mouse model of diabetic nephropathy
- PMID: 19587360
- PMCID: PMC2750227
- DOI: 10.2337/db08-1790
Vasohibin-1, a negative feedback regulator of angiogenesis, ameliorates renal alterations in a mouse model of diabetic nephropathy
Abstract
Objective: The involvement of proangiogenic factors such as vascular endothelial growth factor as well as the therapeutic efficacy of angiogenesis inhibitors in early diabetic nephropathy has been reported. Vasohibin-1 (VASH-1) is a unique endogenous angiogenesis inhibitor that is induced in endothelial cells by proangiogenic factors. We investigated the therapeutic efficacy of VASH-1 in an early diabetic nephropathy model.
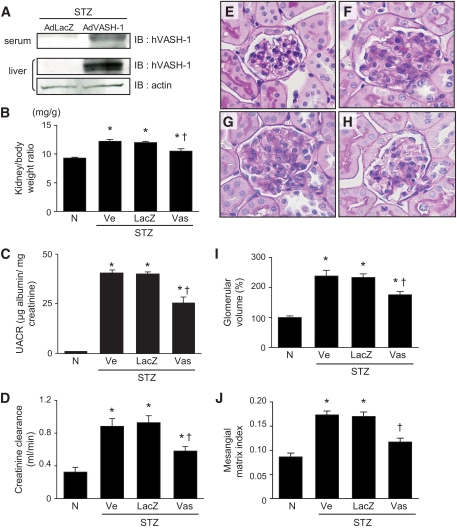
Research design and methods: Streptozotocin- induced type 1 diabetic mice received intravenous injections of adenoviral vectors encoding VASH-1 (AdhVASH-1) or beta-gal (AdLacZ) every other week and were killed after 28 days.
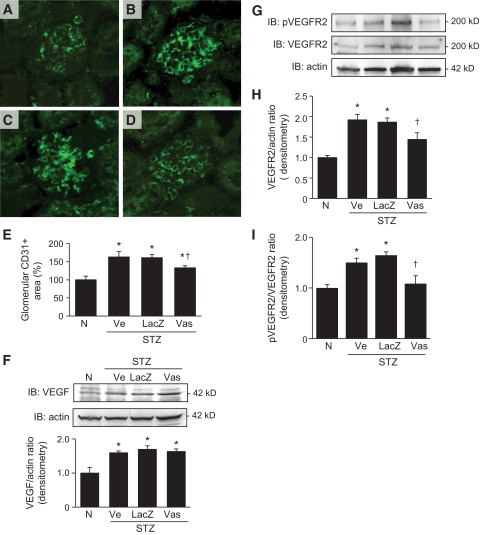
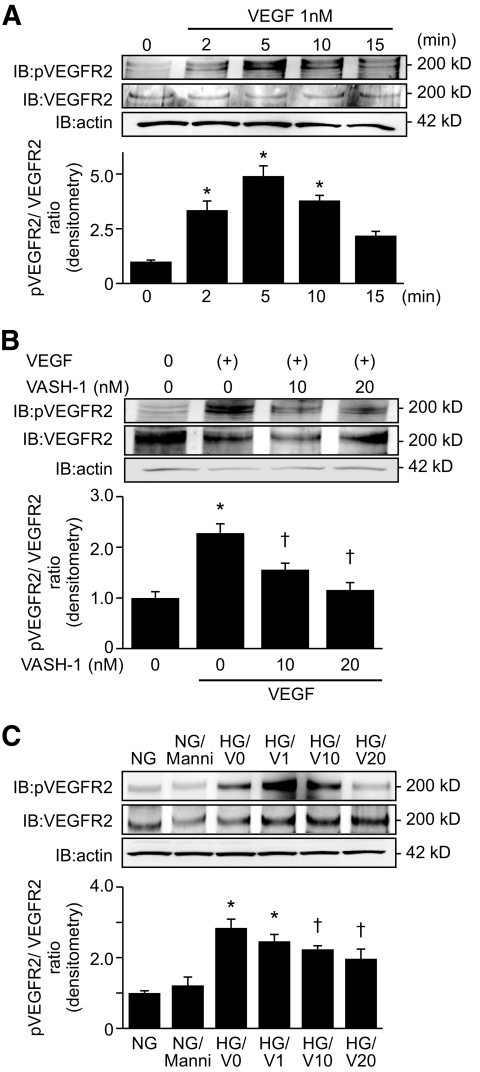
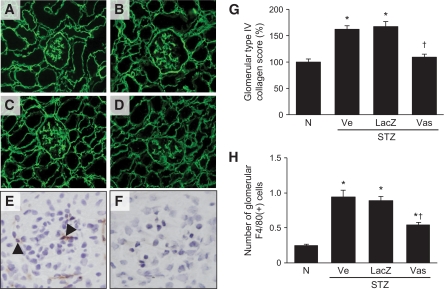
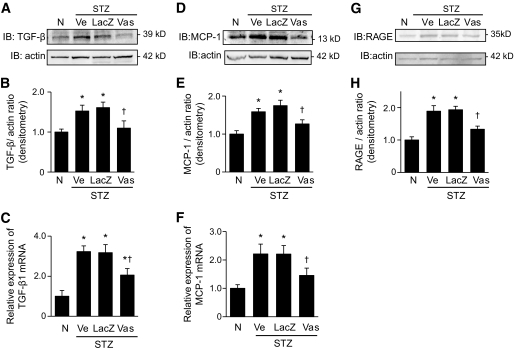
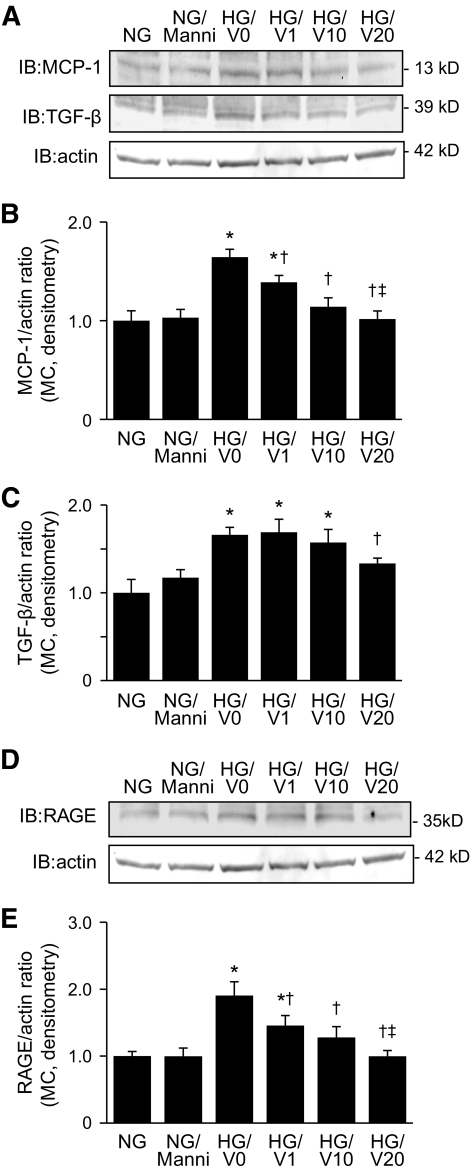
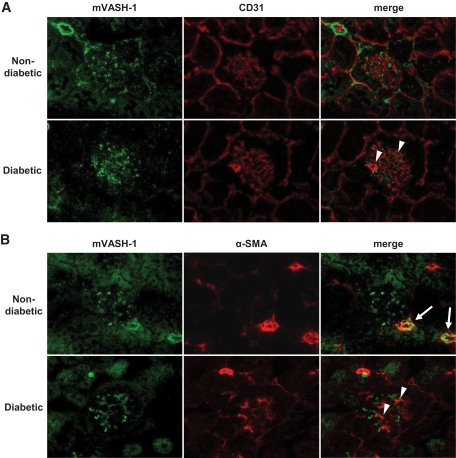
Results: Treatment with AdhVASH-1 resulted in sustained increase in the protein levels of VASH-1 in the liver and sera, in the absence of any inflammatory alterations. AdhVASH-1 treatment significantly suppressed renal hypertrophy, glomerular hypertrophy, glomerular hyperfiltration, albuminuria, increase of the CD31(+) glomerular endothelial area, F4/80(+) monocyte/macrophage infiltration, the accumulation of type IV collagen, and mesangial matrix compared with AdLacZ-treated diabetic mice. Increase in the renal levels of transforming growth factor-beta1, monocyte chemoattractant protein-1, and receptor for advanced glycation end products in diabetic animals was significantly suppressed by AdhVASH-1 (real-time PCR and immunoblot). VASH-1 significantly suppressed the increase of transforming growth factor-beta, monocyte chemoattractant protein-1, and receptor for advanced glycation end products, induced by high ambient glucose in cultured mouse mesangial cells. Increased phosphorylation of VEGFR2 was suppressed in AdVASH-1-treated diabetic animals and in cultured glomerular endothelial cells. Endogenous mouse VASH-1 was localized to the mesangial and endothelial area in glomeruli of diabetic mice.
Conclusions: These results suggest the potential therapeutic efficacy of VASH-1 in treating early diabetic nephropathy potentially mediated via glomerular endothelial and mesangial cells.
Figures
Similar articles
-
Amelioration of renal alterations in obese type 2 diabetic mice by vasohibin-1, a negative feedback regulator of angiogenesis.Am J Physiol Renal Physiol. 2011 Apr;300(4):F873-86. doi: 10.1152/ajprenal.00503.2010. Epub 2011 Jan 12. Am J Physiol Renal Physiol. 2011. PMID: 21228103
-
Antiangiogenic endostatin peptide ameliorates renal alterations in the early stage of a type 1 diabetic nephropathy model.Diabetes. 2005 Oct;54(10):2891-903. doi: 10.2337/diabetes.54.10.2891. Diabetes. 2005. PMID: 16186390
-
Deletion of pro-angiogenic factor vasohibin-2 ameliorates glomerular alterations in a mouse diabetic nephropathy model.PLoS One. 2018 Apr 11;13(4):e0195779. doi: 10.1371/journal.pone.0195779. eCollection 2018. PLoS One. 2018. PMID: 29641565 Free PMC article.
-
Antiangiogenic Therapy for Diabetic Nephropathy.Biomed Res Int. 2017;2017:5724069. doi: 10.1155/2017/5724069. Epub 2017 Aug 1. Biomed Res Int. 2017. PMID: 28835895 Free PMC article. Review.
-
Microinflammation in the pathogenesis of diabetic nephropathy.J Diabetes Investig. 2013 Mar 18;4(2):142-9. doi: 10.1111/jdi.12050. J Diabetes Investig. 2013. PMID: 24843643 Free PMC article. Review.
Cited by
-
Antiangiogenic therapy in diabetic nephropathy: A double‑edged sword (Review).Mol Med Rep. 2021 Apr;23(4):260. doi: 10.3892/mmr.2021.11899. Epub 2021 Feb 8. Mol Med Rep. 2021. PMID: 33655322 Free PMC article. Review.
-
Engeletin protects against cerebral ischemia/reperfusion injury by modulating the VEGF/vasohibin and Ang-1/Tie-2 pathways.Braz J Med Biol Res. 2021 Jul 16;54(10):e11028. doi: 10.1590/1414-431X2020e11028. eCollection 2021. Braz J Med Biol Res. 2021. PMID: 34287581 Free PMC article.
-
Anti-high Mobility Group Box 1 Antibody Ameliorates Albuminuria in MRL/lpr Lupus-Prone Mice.Mol Ther Methods Clin Dev. 2017 May 25;6:31-39. doi: 10.1016/j.omtm.2017.05.006. eCollection 2017 Sep 15. Mol Ther Methods Clin Dev. 2017. PMID: 28649578 Free PMC article.
-
Role of VEGF-A and LRG1 in Abnormal Angiogenesis Associated With Diabetic Nephropathy.Front Physiol. 2020 Aug 31;11:1064. doi: 10.3389/fphys.2020.01064. eCollection 2020. Front Physiol. 2020. PMID: 32982792 Free PMC article. Review.
-
VASH-1 Regulates Oxidative Stress and Fibrosis in Diabetic Kidney Disease via SIRT1/HIF1α and TGFβ1/Smad3 Signaling Pathways.Front Mol Biosci. 2020 Jul 10;7:137. doi: 10.3389/fmolb.2020.00137. eCollection 2020. Front Mol Biosci. 2020. PMID: 32754616 Free PMC article.
References
-
- Makino H, Kashihara N, Sugiyama H, Kanao K, Sekikawa T, Okamoto K, Maeshima Y, Ota Z, Nagai R: Phenotypic modulation of the mesangium reflected by contractile proteins in diabetes. Diabetes 1996;45:488–495 - PubMed
-
- Sharma K, Ziyadeh FN: Hyperglycemia and diabetic kidney disease. The case for transforming growth factor-β as a key mediator. Diabetes 1995;44:1139–1146 - PubMed
-
- Brownlee M, Cerami A, Vlassara H: Advanced glycosylation end products in tissue and the biochemical basis of diabetic complications. N Engl J Med 1988;318:1315–1321 - PubMed
-
- Folkman J: Angiogenesis in cancer, vascular, rheumatoid and other disease. Nat Med 1995;1:27–31 - PubMed
-
- Ferrara N: Vascular endothelial growth factor and the regulation of angiogenesis. Recent Prog Horm Res 2000;55:15–35 - PubMed
Publication types
MeSH terms
Substances
LinkOut - more resources
Full Text Sources
Medical
Research Materials
