. 2009 Aug;119(8):2423-34.
doi: 10.1172/JCI36908. Epub 2009 Jul 1.

The circadian clock protein Period 1 regulates expression of the renal epithelial sodium channel in mice

Affiliations

The circadian clock protein Period 1 regulates expression of the renal epithelial sodium channel in mice

Michelle L Gumz et al. J Clin Invest. 2009 Aug.

Abstract

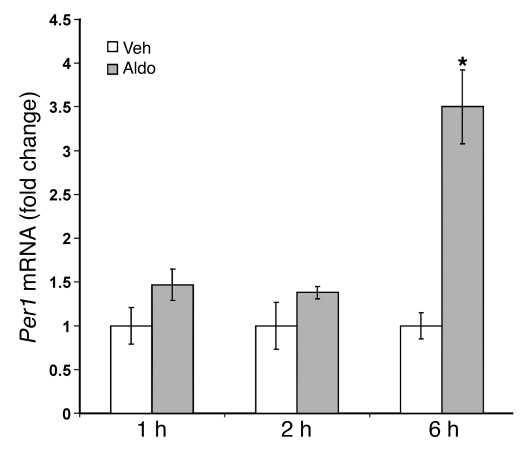
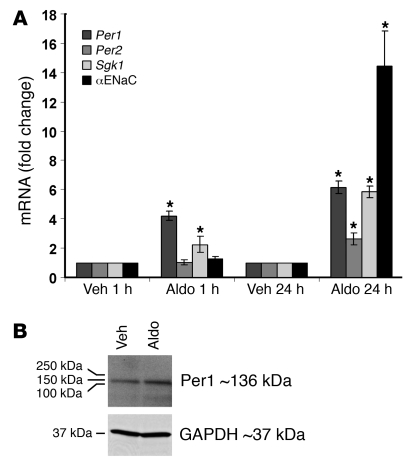
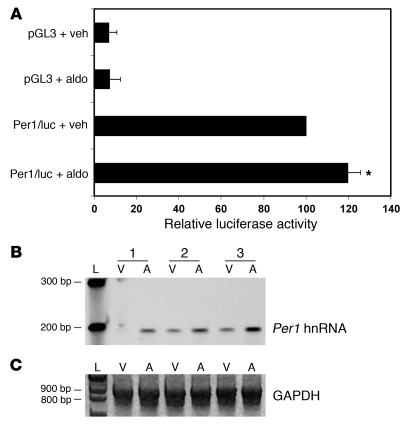
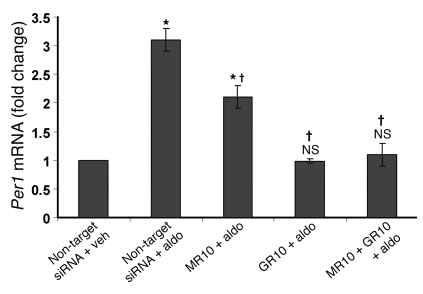
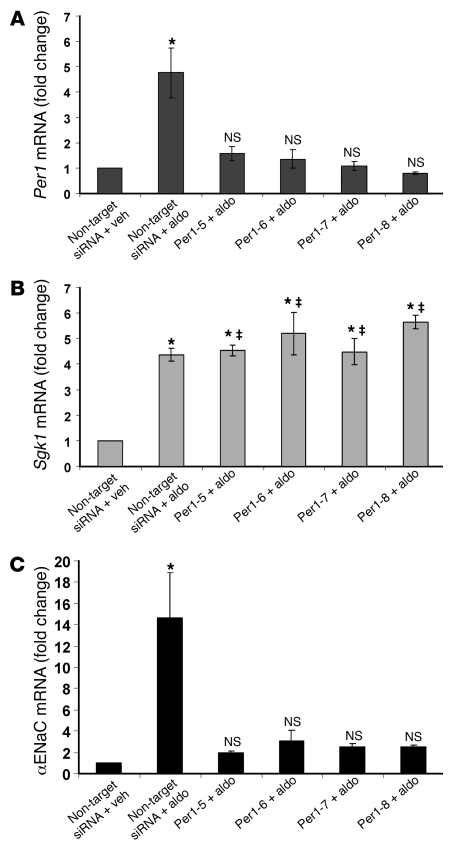
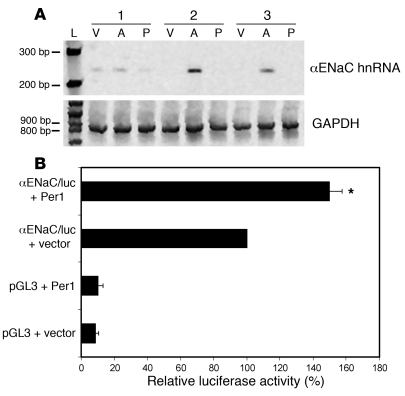
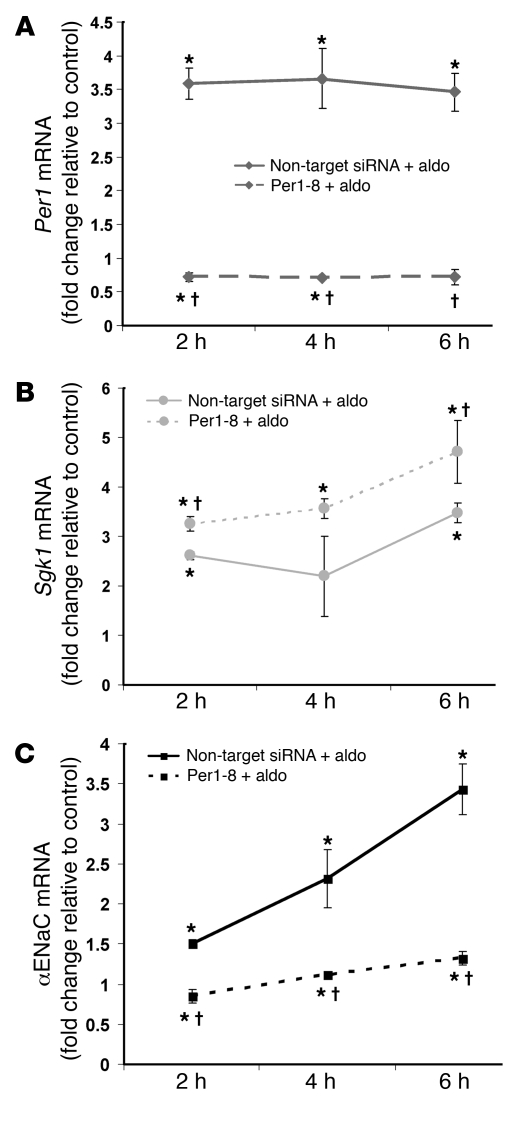
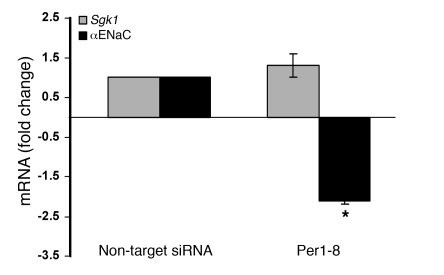
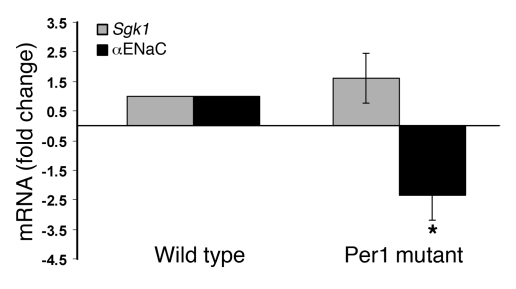
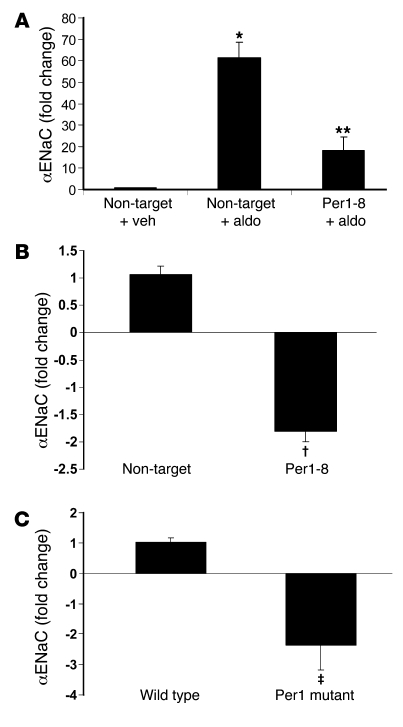
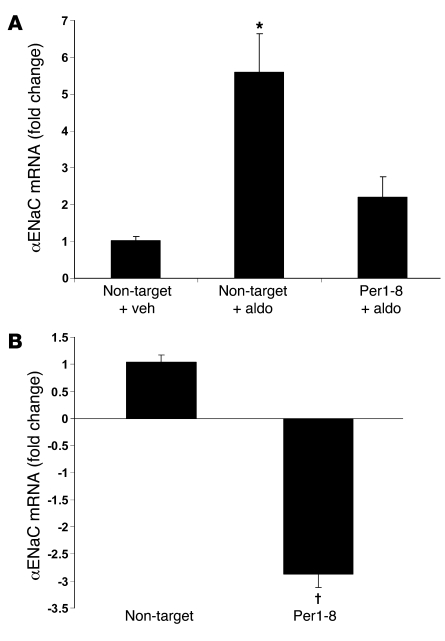
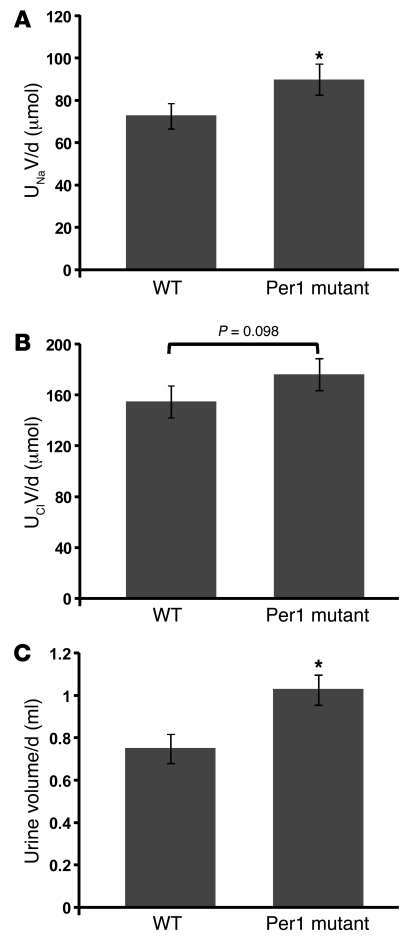
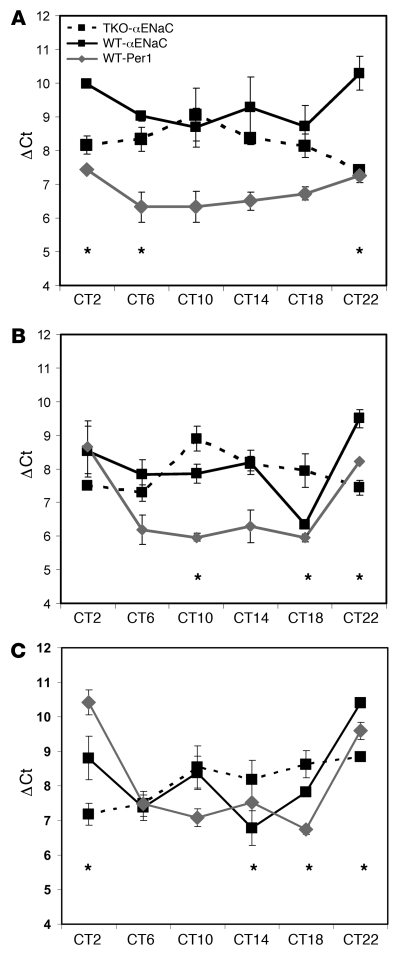
The mineralocorticoid aldosterone is a major regulator of sodium transport in target epithelia and contributes to the control of blood pressure and cardiac function. It specifically functions to increase renal absorption of sodium from tubular fluid via regulation of the alpha subunit of the epithelial sodium channel (alphaENaC). We previously used microarray technology to identify the immediate transcriptional targets of aldosterone in a mouse inner medullary collecting duct cell line and found that the transcript induced to the greatest extent was the circadian clock gene Period 1. Here, we investigated the role of Period 1 in mediating the downstream effects of aldosterone in renal cells. Aldosterone treatment stimulated expression of Period 1 (Per1) mRNA in renal collecting duct cell lines and in the rodent kidney. RNA silencing of Period 1 dramatically decreased expression of mRNA encoding alphaENaC in the presence or absence of aldosterone. Furthermore, expression of alphaENaC-encoding mRNA was attenuated in the renal medulla of mice with disruption of the Per1 gene, and these mice exhibited increased urinary sodium excretion. Renal alphaENaC-encoding mRNA was expressed in an apparent circadian pattern, and this pattern was dramatically altered in mice lacking functional Period genes. These results suggest a role for Period 1 in the regulation of the renal epithelial sodium channel and more broadly implicate the circadian clock in control of sodium balance.


Figures

Figure 1
Figure 1. Per1 is induced by aldosterone in vivo.
Male Sprague-Dawley rats were injected with vehicle (ethanol, Veh) or aldosterone (1 mg/kg, Aldo). Animals were euthanized and inner medullas dissected 1, 2, or 6 hours after the injection. QPCR was used to measure changes in gene expression. Fold change values were calculated relative to actin and compared with vehicle-treated control animals. Data are presented as mean ± SEM; n ≥ 5. *P < 0.05 versus vehicle.
Figure 2
Figure 2. Per1 is upregulated by aldosterone in mIMCD-3 cells.
(A) QPCR was used to calculate changes in gene expression of Per1, Per2, Sgk1, and αENaC in aldosterone-treated compared with vehicle-treated cells. Fold change values were normalized against actin levels, relative to the vehicle control, and are presented as mean ± SD; n = 3. *P < 0.05 versus vehicle control. (B) Total cell lysate was collected from mIMCD-3 cells treated with vehicle or aldosterone for 6 hours. Western blot analysis was performed using an anti-Per1 antibody. GAPDH was used as a loading control.
Figure 3
Figure 3. Per1 is transcriptionally regulated by aldosterone.
(A) Mouse IMCD-3 cells were transfected with pRL Renilla luciferase and either the pGL3 empty vector or a plasmid containing 2,002 bp of the Per1 promoter cloned in front of the firefly luciferase cDNA (Per1/luc). Twenty-four hours later, cells were treated with vehicle or aldosterone for 6 hours. Data are presented as mean ± SEM; n = 4. *P < 0.05 versus Per/luc plus vehicle. (B) Primers were designed to amplify a 191-bp region of the Per1 gene between exon 7 and intron 7 in order to measure hnRNA as an indicator of transcriptional activity in 3 (nos. 1–3) independent sets of template from vehicle- or aldosterone-treated mIMCD-3 cells; n = 3. L, ladder; V, vehicle; A, aldosterone. (C) An 874-bp GAPDH product was amplified as a PCR control.
Figure 4
Figure 4. Contribution of MR and GR to the aldosterone-mediated regulation of Per1.
Mouse IMCD-3 cells were transfected with a non-target control siRNA or siRNA for MR (MR10) or GR (GR10). Twenty-four hours later, cells were treated with vehicle or aldosterone for 1 hour. Changes in gene expression were measured using QPCR. Data are presented as mean ± SEM; n = 3. *P < 0.05 versus non-target siRNA–transfected cells treated with vehicle; P < 0.05 versus non-target siRNA–transfected cells treated with aldosterone; NS, not significant versus non-target siRNA–transfected cells treated with vehicle.
Figure 5
Figure 5. Per1 knockdown attenuates the response of αENaC to aldosterone.
Mouse IMCD-3 cells were transfected with Per1 siRNA sequences 24 hours prior to vehicle or aldosterone treatment. QPCR was used to analyze changes in gene expression of Per1 (A), Sgk1 (B), and αENaC (C) after Per1 knockdown in the presence of aldosterone compared with vehicle-treated non-target siRNA–transfected cells. Fold change values were normalized against actin and are presented as mean ± SEM; n = 4 (n = 3 for Per1-5 and Per1-6). *P < 0.05 versus non-target siRNA vehicle control; NS, not significant versus non-target siRNA–transfected cells treated with vehicle; not significant versus non-target siRNA aldosterone-treated sample.
Figure 6
Figure 6. Effect of Per1 knockdown on αENaC is transcriptional.
(A) Top panel: Primers were designed to amplify a 238-bp region of the Scnn1a (αENaC) gene between exon 8 and intron 8 in order to measure hnRNA as an indicator of transcriptional activity. Templates from 3 (nos. 1–3) independent sets of non-target siRNA– or Per1-8 siRNA–transfected mIMCD-3 cells treated with vehicle or aldosterone were used in PCR reactions; n = 3. V, non-target siRNA–transfected cells plus vehicle; A, non-target siRNA–transfected cells plus aldosterone; P, Per1-8 plus aldosterone. Bottom panel: An 874-bp GAPDH product was amplified as a PCR control. (B) αENaC promoter luciferase activity was measured as described in Figure 3. Mouse IMCD-3 cells were cotransfected with pGL3 or αENaC/luc and empty pCMVSport6 vector or Per1 expression vector. Data are presented as mean ± SEM; n = 4. *P < 0.05 versus αENaC/luc plus vector.
Figure 7
Figure 7. Effect of Per1 knockdown on αENaC occurs in the early phase of aldosterone action.
Mouse IMCD-3 cells were transfected with a non-target siRNA or Per1-8 siRNA for 24 hours and then treated with vehicle or aldosterone for 2, 4, or 6 hours. QPCR was used to analyze changes in gene expression of Per1 (A), Sgk1 (B), and αENaC (C) after Per1 knockdown in the presence of aldosterone compared with control (vehicle treated, non-target siRNA–transfected cells; data not shown). Fold change values were normalized against actin relative to the non-target siRNA–transfected, vehicle-treated control. Data are presented as mean ± SEM; n = 3. *P < 0.05 versus control; P < 0.05 versus non-target siRNA–transfected cells treated with aldosterone.
Figure 8
Figure 8. αENaC expression is inhibited by Per1 knockdown in the absence of aldosterone.
Mouse IMCD-3 cells were transfected with a non-target siRNA or Per1-8 siRNA. Forty-eight hours later, total RNA was isolated and processed for QPCR. Fold changes in Sgk1 and αENaC were normalized against actin relative to the non-target siRNA–transfected cells. Data are presented as mean ± SEM; n = 4. *P < 0.05 versus non-target siRNA–transfected cells.
Figure 9
Figure 9. αENaC expression is attenuated in the inner medulla of Per1-deficient mice.
Total RNA was isolated from the inner medullas of wild-type (129/Sv) or Per1-deficient mice. QPCR was used to analyze changes in gene expression of Sgk1 (gray bars) and αENaC (black bars) in Per1-deficient compared with wild-type control animals. Fold change values were normalized against actin relative to wild-type control mice. Data are presented as mean ± SEM; n = 3. *P < 0.05 versus wild-type.
Figure 10
Figure 10. Per1 mediates regulation of αENaC expression in the outer medulla.
(A) The induction of αENaC by aldosterone is attenuated in OMCD1 cells after Per1 knockdown. OMCD1 cells were grown, siRNA-transfected, and treated with vehicle or aldosterone as described for mIMCD-3 cells. *P < 0.05 versus non-target siRNA–transfected cells treated with vehicle; **P < 0.05 versus non-target siRNA–transfected cells treated with aldosterone; n = 4. (B) In the absence of aldosterone, Per1 knockdown results in a 2-fold decrease in αENaC mRNA levels in OMCD1 cells. P < 0.05 versus non-target siRNA–infected cells; n = 6. (C) Per1-deficient mice exhibit reduced αENaC expression in the outer medulla. P < 0.05 versus wild-type; n = 3. All data are presented as mean ± SEM.
Figure 11
Figure 11. Per1 mediates regulation of αENaC expression in the cortex.
(A) The induction of αENaC by aldosterone is attenuated in mpkCCDc14 cells after Per1 knockdown. mpkCCDc14 cells were grown, siRNA-transfected, and treated with vehicle or aldosterone as described for mIMCD-3 cells. *P < 0.05 versus non-target siRNA–transfected cells treated with vehicle; n = 4. (B) In the absence of aldosterone, Per1 knockdown results in a 2-fold decrease in αENaC mRNA levels in mpkCCDc14 cells. P < 0.05; n = 6. All data are presented as mean ± SEM.
Figure 12
Figure 12. Mice lacking Per1 excrete more sodium compared with wild-type mice.
Per1 mutant mice (n = 3) or wild-type mice (n = 4) were housed in metabolic cages and maintained on a normal laboratory chow diet with free access to water for 48 hours. Food and water intake and body weight were monitored. Two 24-hour urine collections were made. Urine was analyzed for Na (UNaV; A), Cl (UClV, B), and total volume (C). *P < 0.05 versus wild-type. Data are presented as mean ± SEM.
Figure 13
Figure 13. The expression profile of αENaC is altered in Period-deficient mice.
Inner medullas (A), outer medullas (B), and cortex (C) were dissected from 3 wild-type or 3 TKO mice that were euthanized every 4 hours over a 24-hour period. Total RNA was isolated and converted to cDNA for QPCR analysis. The data are expressed as the ΔCt value, which is a measure of expression relative to actin (higher ΔCt values correspond to lower expression; see ref. 49), versus the circadian time (CT2–CT22). Data are presented as mean ± SEM; n = 3 for each data point. *P < 0.05, wild-type αENaC expression versus TKO.

References

    1. Goodfriend T.L. Aldosterone — a hormone of cardiovascular adaptation and maladaptation. . J. Clin. Hypertens. (Greenwich). 2006;8:133–139. doi: 10.1111/j.1524-6175.2006.05110.x. - DOI - PMC - PubMed
    1. Pitt B. Effect of aldosterone blockade in patients with systolic left ventricular dysfunction: implications of the RALES and EPHESUS studies. Mol. Cell. Endocrinol. 2004;217:53–58. doi: 10.1016/j.mce.2003.10.009. - DOI - PubMed
    1. Booth R.E., Johnson J.P., Stockand J.D. Aldosterone. Adv. Physiol. Educ. 2002;26:8–20. - PubMed
    1. Gumz M.L., Popp M.P., Wingo C.S., Cain B.D. Early transcriptional effects of aldosterone in a mouse inner medullary collecting duct cell line. Am. J. Physiol. Renal Physiol. 2003;285:F664–F673. - PubMed
    1. Escoubet B., Coureau C., Bonvalet J.P., Farman N. Noncoordinate regulation of epithelial Na channel and Na pump subunit mRNAs in kidney and colon by aldosterone. Am. J. Physiol. 1997;272:C1482–C1491. - PubMed

Publication types

MeSH terms