. 2009 Aug 13;460(7257):863-8.
doi: 10.1038/nature08212. Epub 2009 Jul 8.

Chd1 regulates open chromatin and pluripotency of embryonic stem cells

Affiliations

Chd1 regulates open chromatin and pluripotency of embryonic stem cells

Alexandre Gaspar-Maia et al. Nature. .

Abstract

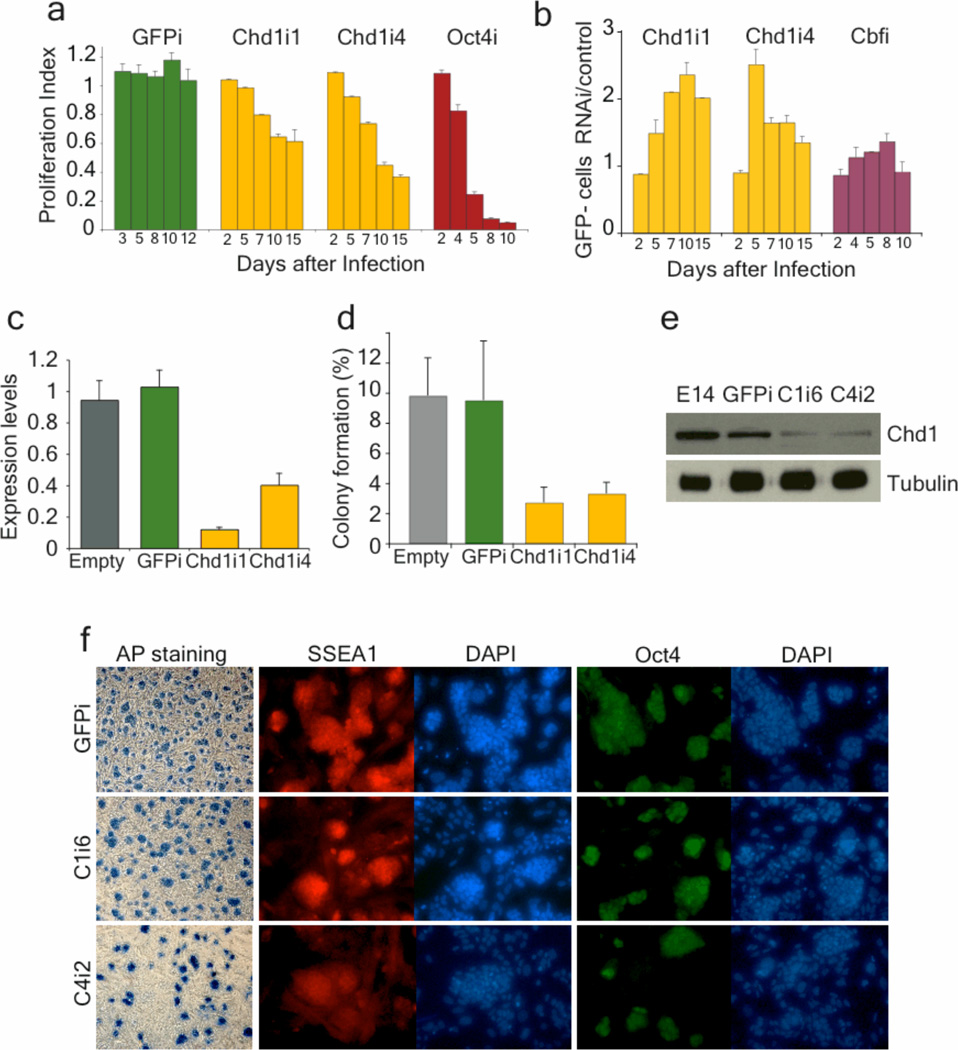
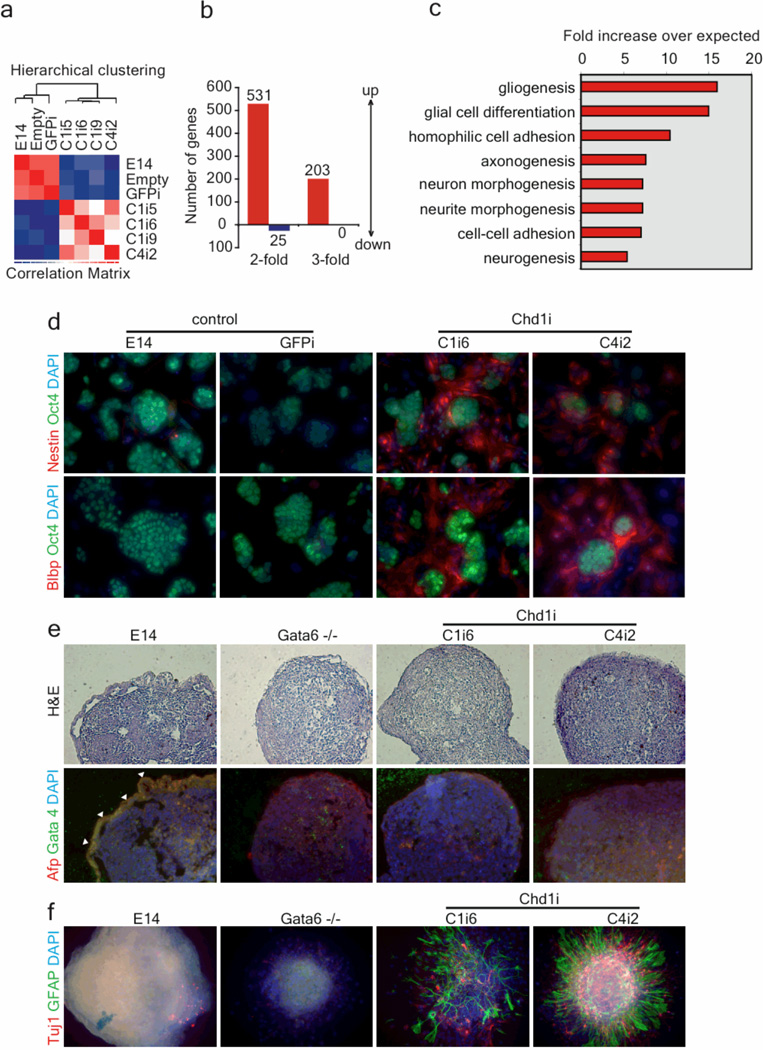
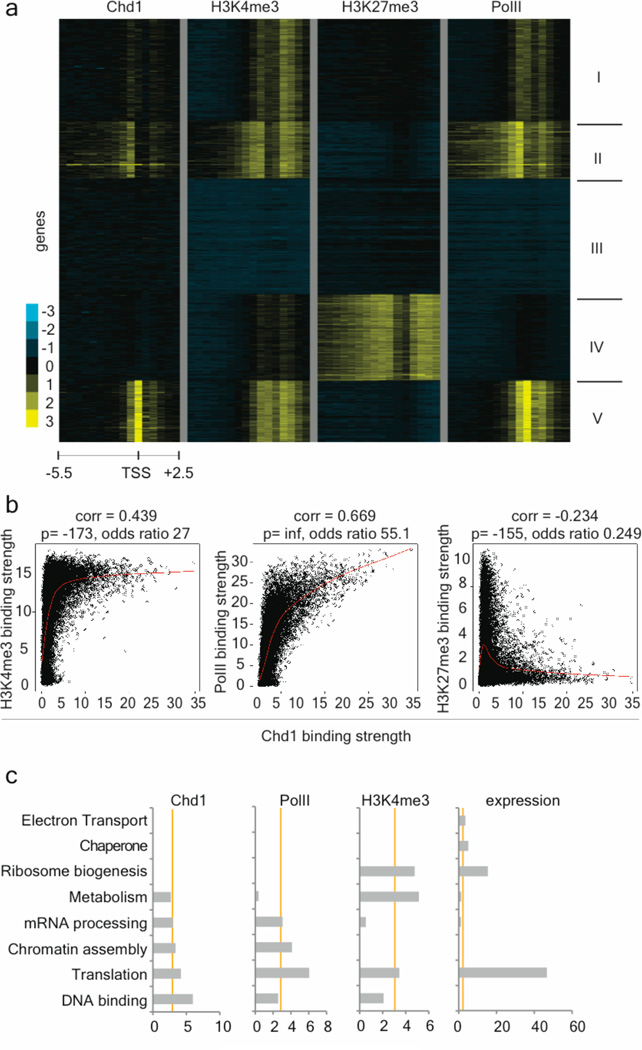
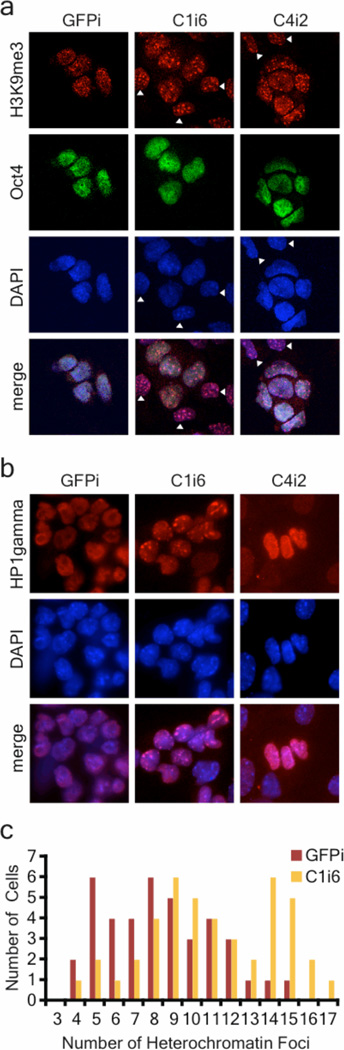
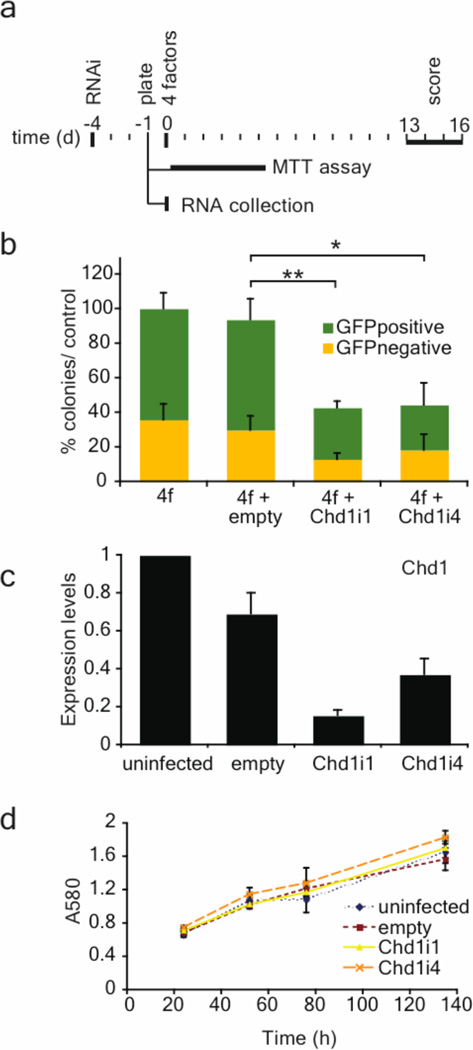
An open chromatin largely devoid of heterochromatin is a hallmark of stem cells. It remains unknown whether an open chromatin is necessary for the differentiation potential of stem cells, and which molecules are needed to maintain open chromatin. Here we show that the chromatin remodelling factor Chd1 is required to maintain the open chromatin of pluripotent mouse embryonic stem cells. Chd1 is a euchromatin protein that associates with the promoters of active genes, and downregulation of Chd1 leads to accumulation of heterochromatin. Chd1-deficient embryonic stem cells are no longer pluripotent, because they are incapable of giving rise to primitive endoderm and have a high propensity for neural differentiation. Furthermore, Chd1 is required for efficient reprogramming of fibroblasts to the pluripotent stem cell state. Our results indicate that Chd1 is essential for open chromatin and pluripotency of embryonic stem cells, and for somatic cell reprogramming to the pluripotent state.


Figures

Figure 1
Figure 1. Chd1i ES cells have decreased self-renewal but maintain expression of markers of the undifferentiated state
a, A competition assay shows that down-regulation of Chd1 in Oct4-GiP ES cells using two independent shRNA (Chd1i1 and Chd1i4) leads to a decreased proliferative capacity. The proliferation index represents the population of mCherry+ cells (which are undergoing RNAi) relative to cells infected with empty vector, at each timepoint. Experiments were done in triplicate and are represented as mean ± s.d. (n=3). b, Down-regulation of Chd1 leads to reduced activity of the Oct4-GFP reporter, as measured by the ratio between percentage of GFP-negative cells in RNAi and in empty vector. Chd1i cells have a 2-fold reduction of Oct4-GFP relative to controls for at least one passage. Down-regulation of a different gene that affects only proliferation (Cbf) has little effect on Oct4-GFP expression. c, Chd1 down-regulation upon RNAi was confirmed by qRT-PCR on cells isolated by FACS for mCherry +. The values are represented as mean of absolute expression ± s.d. (n=3). d, mCherry+ E14 cells isolated by FACS were plated at low density for colony-formation assays. The efficiency of colony formation in Chd1i ES cells was decreased relative to controls (empty and GFPi). The values are represented as mean ± s.d. (n=3), and are representative of two independent experiments. No colonies were recovered when Oct4 was down-regulated. e, Immunoblot with whole cell extracts from 2 control cell lines (parental E14 and GFPi cells) and 2 Chd1i ES cell clones (C1i6 and C4i2), using antibodies against Chd1 or alpha-Tubulin (as a loading control). Chd1 protein is down-regulated upon RNAi. f, Chd1i cells still express markers of undifferentiated ES cells, such as alkaline phosphatase (shown in bright field), and SSEA1 and Oct4 (shown with immunofluorescence).
Figure 2
Figure 2. Chd1 is required for ES cell pluripotency
a, Microarray analysis of 4 Chd1i clones, three from Chd1i1 (C1i5, C1i6 and C1i9) and one from Chd1i4 (C4i2), and 3 control cell lines, E14, empty virus-infected, and GFPi. The transcriptional profiles of Chd1i clones cluster together and are distinct from the controls. b, Few genes are downregulated in Chd1i ES cells relative to controls, but a significantly larger subset of genes are up-regulated. c, The subset of up-regulated genes is enriched for genes with roles in neurogenesis, as determined by Gene Ontology term analysis. All terms shown have p-values adjusted for multiple testing ≤0.01. d, Immunofluorescence analysis of Chd1i cells shows expression of both Nestin and Blbp, but in a population not expressing the ES cell marker Oct4. e, ES cells were cultured in non-attachment conditions and without LIF to form embryoid bodies (EBs). Lack of primitive endoderm development in Chd1i cells was observed by staining paraffin sections of 6 day EBs for Afp and Gata4, and hematoxilineosin. The loss of primitive endoderm layer (highlighted in control GFPi with white arrows) in Chd1i EBs is similar to that observed in EBs mutant for Gata6. f, A significant increase in neural differentiation is observed, as detected by staining EBs (plated on matrigel) for astrocytes (GFAP) and neurons (Tuj1), in 12 day Chd1i EBs, relative to controls.
Figure 3
Figure 3. Chd1 associates with euchromatic promoter regions in ES cells
a, Chd1 binding correlates with binding of H3K4me3 and RNA Polymerase II (PolII) but is excluded from bivalent domains in ES cells. K-means clustering of Chd1, H3K4me3, H3K27me3 and RNA PolII binding in ES cells. Each row represents the binding pattern along the −5.5kb to +2.5kb promoter region relative to the transcription start site (TSS), reiterated four times to present the data for each immunoprecipitation. The 8 kb promoter region is divided into sixteen 500bp fragments that display the average log ratio of probe signal intensity with blue, yellow, and grey representing lower-than-average, higher-than-average, and missing values for enrichment due to lack of probes in those regions, respectively. Note lack of Chd1 binding in cluster IV which consists of genes with bivalent domains. b, Genes strongly bound by Chd1 are characterized by high enrichment of H3K4me3 and RNA PolII and lack H3K27me3. Binary correlation of Chd1 binding strength with that of H3K4me3 (left panel), RNA PolII (middle panel) and H3K27me3 (right panel) for each gene (black dot) present on the promoter array. The Pearson correlation value, the –log 10 of the p value of the correlation as determined by Fisher’s exact test and the odds ratio are presented above each plot. Lowess normalization was used to generate the smoother indicated by the red line, revealing the anti-correlation of Chd1 binding with H3K27me3 and positive correlation with RNA PolII and H3K4me3. c, Functional categorization of Chd1 targets. Gene Ontology (GO) terms associated with the 200 genes most strongly bound by Chd1 or RNA PolII, or enriched for H3K4me3, as well as the top 200 genes in expression level in ES cells. Categories above an enrichment score of 3 (X-axes) are considered significantly enriched. 69 genes overlap between the Chd1 and RNA PolII top 200 gene lists, versus 27 for Chd1/expression and 13 for Chd1/H3K4me3.
Figure 4
Figure 4. Chd1 is required to maintain open chromatin in ES cells
a, Analysis of H3K9me3 staining by immunofluorescence. Co-staining for H3K9me3 and Oct4 distinguishes between ES-like cells (Oct4-positive) and differentiating cells (Oct4-negative, white arrow). Oct4-positive Chd1i ES-like cells have increased heterochromatin foci. b, Immunofluorescence of Chd1i cells for the heterochromatin mark HP1gamma shows accumulation in heterochromatin foci, whereas localization in the GFPi cells is diffuse throughout the nucleoplasm. c, Quantification of the increase of heterochromatin foci per nucleus in Chd1i ES-like cells, as seen by H3K9me3 staining in Oct4-positive cells, p<0.0005.
Figure 5
Figure 5. Chd1 is required for efficient induction of pluripotency
a, Oct4-GFP MEFs were reprogrammed using lentiviral infection (day 0) of four transcription factors (Oct4, Sox2, nMyc and Klf4). RNAi lentiviral vectors (empty, Chd1i1, Chd1i4) were used to infect MEFs 4 days before the addition of the 4 factors. At day −1, MEFs were also plated for a MTT assay to quantify growth rates and for RNA collection for qRT-PCR for Chd1. b, The percentage of reprogrammed colonies was scored both by morphology and GFP expression, and normalized to the total number of colonies obtained in the control (4 factors only). The values are represented as mean ± s.d. of the averages of three independent experiments, each one done in duplicates or triplicates. The total number of colonies in control wells (4f or 4f+empty) in the three separate experiments varied between 200 and 500 per 6-well. The efficiency of induction of pluripotency is significantly reduced upon Chd1 RNAi. Unpaired t-test was performed using the total number of colonies obtained, comparing the control (empty) with RNAi against Chd1 (Chd1i1 and Chd1i4). * represents p<0.0001, ** represents p<0.00001. c, Chd1 down-regulation upon RNAi was confirmed by qRT-PCR. The values are represented as mean of absolute expression ± s.d. (n=3). d, Mean growth rate of MEFs measured by the MTT assay ± s.d. (n=6). No differences in MEF growth rate were observed upon Chd1 RNAi.

Comment in

Similar articles

Cited by

References

Bibliography

    1. Mikkelsen T, et al. Dissecting direct reprogramming through integrative genomic analysis. Nature. 2008:16. - PMC - PubMed
    1. Reddien P, Sanchez-Alvarado A. Fundamentals of Planarian Regenaration. Annu. Rev. Cell. Dev. Biol. 2004;20(1):725. - PubMed
    1. Terstappen LW, et al. Sequential generations of hematopoietic colonies derived from single nonlineage-committed CD34+CD38- progenitor cells. Blood. 1991;77(6):1218. - PubMed
    1. Spangrude GJ, Heimfeld S, Weissman IL. Purification and characterization of mouse hematopoietic stem cells. Science. 1988;241(4861):58. - PubMed
    1. Meshorer E, et al. Hyperdynamic plasticity of chromatin proteins in pluripotent embryonic stem cells. Developmental Cell. 2006;10(1):105. - PMC - PubMed

Methods Bibliography

    1. Ying QL, Nichols J, Evans EP, Smith AG. Changing potency by spontaneous fusion. Nature. 2002;416(6880):545. - PubMed
    1. Reynolds A, et al. Rational siRNA design for RNA interference. Nat Biotechnol. 2004;22(3):326. - PubMed
    1. Ivanova N, et al. Dissecting self-renewal in stem cells with RNA interference. Nature. 2006;442(7102):533. - PubMed
    1. Li C, Wong WH. Model-based analysis of oligonucleotide arrays: expression index computation and outlier detection. Proc Natl Acad Sci USA. 2001;98(1):31. - PMC - PubMed
    1. Doniger SW, et al. MAPPFinder: using Gene Ontology and GenMAPP to create a global gene-expression profile from microarray data. Genome Biol. 2003;4(1):R7. - PMC - PubMed

Publication types

MeSH terms

Associated data