

Biophysical mechanism for ras-nanocluster formation and signaling in plasma membrane
- PMID: 19587789
- PMCID: PMC2704371
- DOI: 10.1371/journal.pone.0006148
Biophysical mechanism for ras-nanocluster formation and signaling in plasma membrane
Abstract
Ras GTPases are lipid-anchored G proteins, which play a fundamental role in cell signaling processes. Electron micrographs of immunogold-labeled Ras have shown that membrane-bound Ras molecules segregate into nanocluster domains. Several models have been developed in attempts to obtain quantitative descriptions of nanocluster formation, but all have relied on assumptions such as a constant, expression-level independent ratio of Ras in clusters to Ras monomers (cluster/monomer ratio). However, this assumption is inconsistent with the law of mass action. Here, we present a biophysical model of Ras clustering based on short-range attraction and long-range repulsion between Ras molecules in the membrane. To test this model, we performed Monte Carlo simulations and compared statistical clustering properties with experimental data. We find that we can recover the experimentally-observed clustering across a range of Ras expression levels, without assuming a constant cluster/monomer ratio or the existence of lipid rafts. In addition, our model makes predictions about the signaling properties of Ras nanoclusters in support of the idea that Ras nanoclusters act as an analog-digital-analog converter for high fidelity signaling.
Conflict of interest statement
Figures
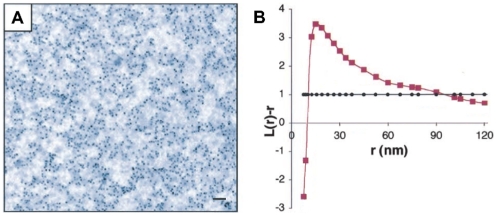
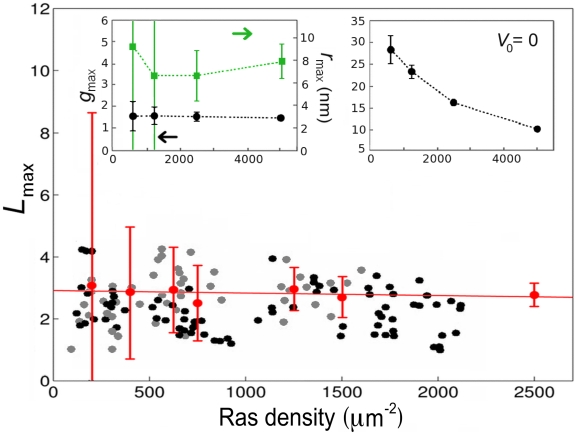
 data points were extracted from Ref. with IMAGE J. (Left inset)
  (black) and
  (green) as a function of λ.(Right inset)
  as a function of λ without long-range repulsion (
 ). Error bars represent standard deviations. For simulation details, including calculation of confidence intervals, see
Methods
.
). Error bars represent standard deviations. For simulation details, including calculation of confidence intervals, see
Methods
.
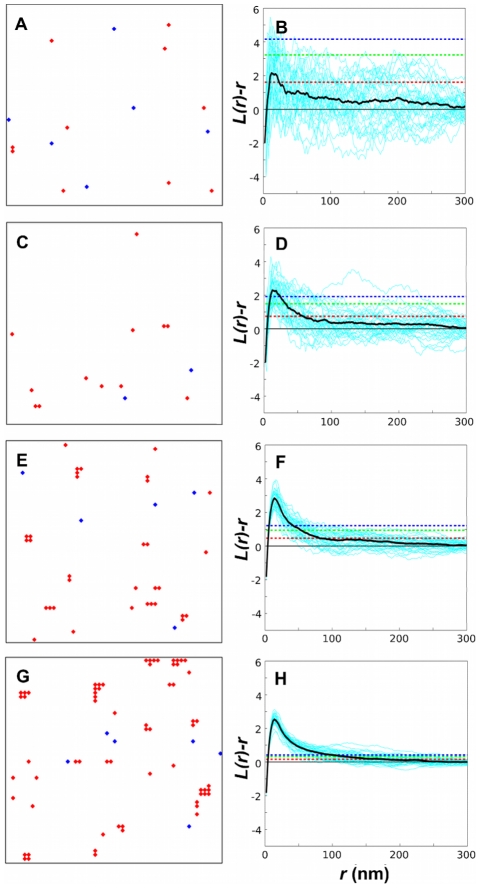
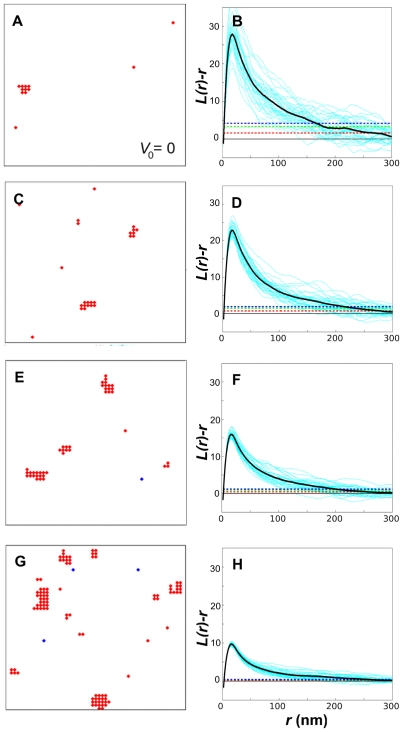
 plots (right column) after gold labeling for the four densities from Table 1 (density of Ras molecules increases from top to bottom). Shown in the
  plots are individual simulations (cyan curves), their averages (thick black curves), as well as 68.3%, 95.4%, and 99.0% confidence intervals (red, green, and blue dashed lines, respectively). For simulation details, including calculation of confidence intervals, see
Methods
.
plots are individual simulations (cyan curves), their averages (thick black curves), as well as 68.3%, 95.4%, and 99.0% confidence intervals (red, green, and blue dashed lines, respectively). For simulation details, including calculation of confidence intervals, see
Methods
.
 (red),
  (blue),
  (green),
  (black) in units of
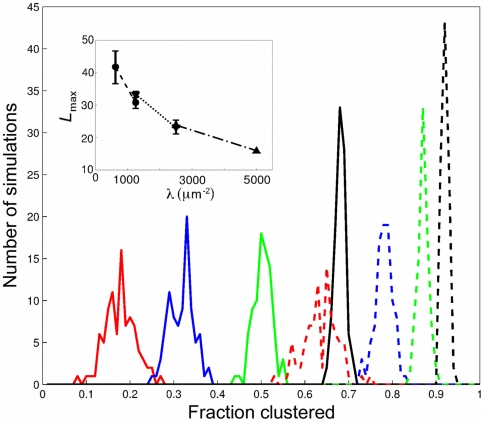
  . Shown are results with (solid lines) and without (dashed lines) long-range repulsion. A Ras cluster is defined as two or more connected Ras molecules. (Inset)
  for pairwise constant fractions (overlapping fractions), i.e. fraction range 0.72–0.75 for
  and 1250 (circles and dashed line), fraction range 0.81–0.84 for
  and 2500 (triangles up and dotted line), and fraction range 0.88–0.91 for
  and 5000 (triangles down and dashed-dotted line).
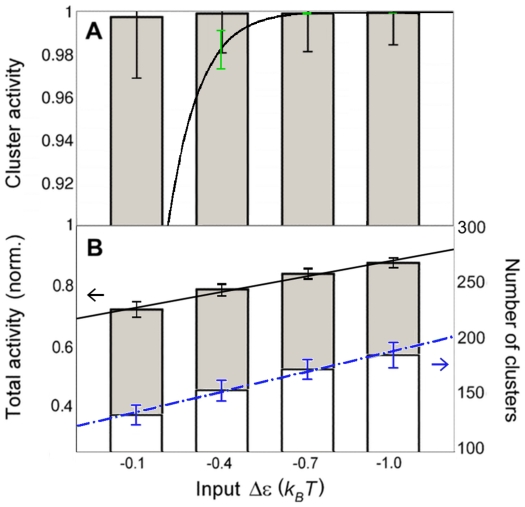
 ). Cluster activity is defined as fraction of active Ras in clusters from simulations (bar chart), where a cluster contains two or more contacting Ras molecules. Also shown is approximate cluster activity
  , which assumes that all N Ras molecules in a cluster (here chose
  ) are tightly coupled and hence are either all on (active) or all off (inactive) together (black line). Black error bars show standard deviation and represent intrinsic noise. Green error bars represent extrinsic noise, calculated with noise propagation formula
  for
for  . (B) Total activity of all Ras molecules in the membrane, normalized by the total number of Ras molecules (grey bar chart, left axis), and number of Ras clusters (white bar chart, right axis). Also shown are linear fits. Error bars represent standard deviations. To enlarge black error bars for better visualization in B, we used the square-root of the total variance from pooled simulations of inputs
  ,
,  , and
, and  .
.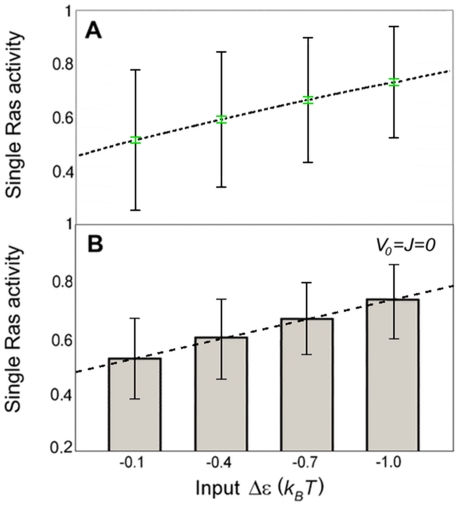
 ) as a function of input (parameter
  ). Black error bars represent intrinsic noise, calculated from the square-root of the binomial variance
  . Green error bars are approximately 0.01 in magnitude and represent extrinsic noise, calculated with the noise propagation formula
  and
and  . (B) Total activity of all Ras molecules in the membrane, normalized by the total number of Ras molecules (bar chart) and linear fit (dashed line). Error bars represent standard deviation, calculated from the square-root of the total variance from pooled simulations of inputs
  ,
,  , and
, and  .
.References
Publication types
MeSH terms
Substances
Grants and funding
LinkOut - more resources
Full Text Sources
