

Quantifying inter- and intra-population niche variability using hierarchical bayesian stable isotope mixing models
- PMID: 19587790
- PMCID: PMC2704373
- DOI: 10.1371/journal.pone.0006187
Quantifying inter- and intra-population niche variability using hierarchical bayesian stable isotope mixing models
Abstract
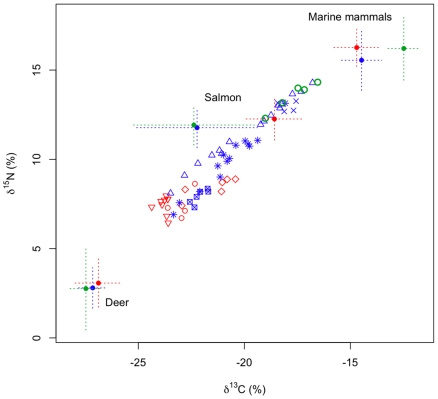
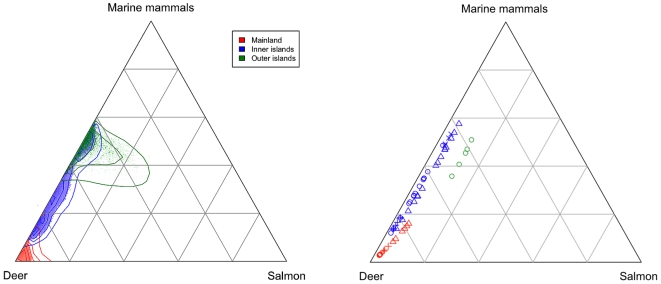
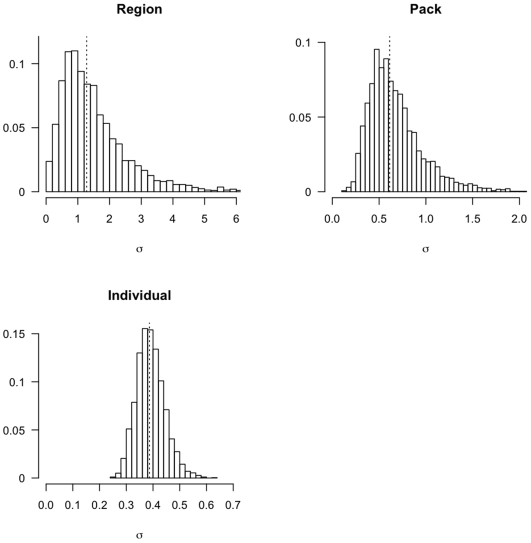
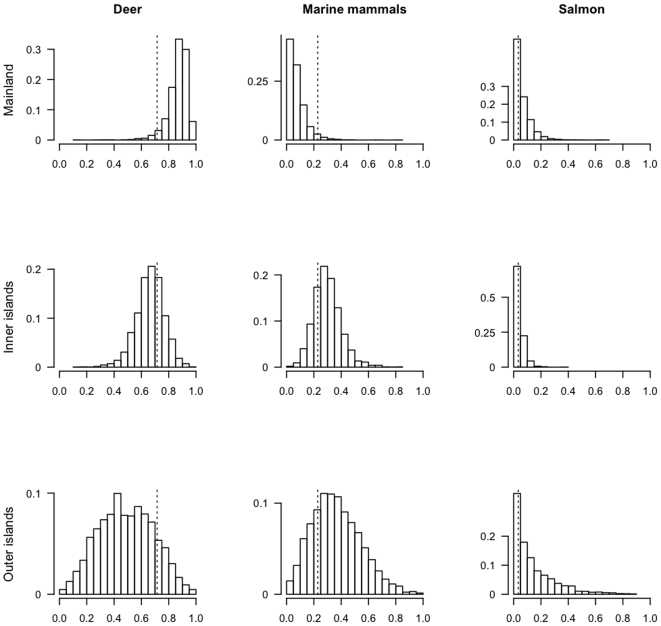
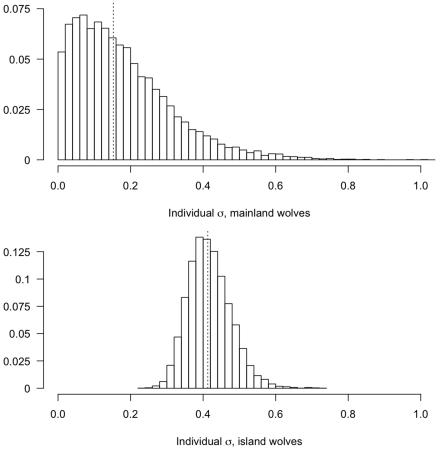
Variability in resource use defines the width of a trophic niche occupied by a population. Intra-population variability in resource use may occur across hierarchical levels of population structure from individuals to subpopulations. Understanding how levels of population organization contribute to population niche width is critical to ecology and evolution. Here we describe a hierarchical stable isotope mixing model that can simultaneously estimate both the prey composition of a consumer diet and the diet variability among individuals and across levels of population organization. By explicitly estimating variance components for multiple scales, the model can deconstruct the niche width of a consumer population into relevant levels of population structure. We apply this new approach to stable isotope data from a population of gray wolves from coastal British Columbia, and show support for extensive intra-population niche variability among individuals, social groups, and geographically isolated subpopulations. The analytic method we describe improves mixing models by accounting for diet variability, and improves isotope niche width analysis by quantitatively assessing the contribution of levels of organization to the niche width of a population.
Conflict of interest statement
Figures
References
-
- Chase JM, Leibold MA. Ecological Niches: Linking Classical and Contemporary Approaches. Chicago, IL: University of Chicago Press; 2003.
-
- Elton CS. Animal Ecology. London: Sidgwick & Jackson; 1927.
-
- Leibold MA. The niche concept revisited: mechanistic models and community context. Ecology. 1995;76:1371–1382.
-
- Hutchinson GE. Concluding Remarks. 1957. pp. 415–427. Symposia on Quantitative Biology; Cold Spring Harbor.
-
- Van Valen L. Morphological variation and width of ecological niche. American Naturalist. 1965;99:377–389.
Publication types
MeSH terms
Substances
LinkOut - more resources
Full Text Sources
Other Literature Sources
