. 2009 Jul 9;4(7):e6188.
doi: 10.1371/journal.pone.0006188.

Staphylococcal enterotoxin A induces small clusters of HLA-DR1 on B cells

Affiliations

Staphylococcal enterotoxin A induces small clusters of HLA-DR1 on B cells

Kedar Narayan et al. PLoS One. .

Abstract

The superantigen SEA causes non-specific hyperactivation of T and B cells at low concentrations. Studies of mutants or soluble proteins suggest SEA is bivalent for its ligand, MHC class II. However, the interaction between these molecules on intact cells is unknown. On primary mouse B cells expressing the MHC class II allele HLA-DR1, measurements of Förster Resonance Energy Transfer between HLA-DR1 molecules on SEA-treated cells indicated specific clustering, not observed in untreated or monovalent superantigen treated cells. Tomographic visualization and electron microscopy of immunogold-labeled SEA-treated B cells revealed small clusters of surface HLA-DR1 (< or = 4 gold labels). These results present direct visual evidence of SEA-mediated clustering of MHC class II molecules on treated antigen presenting cells, and provide a new structural approach to addressing problems of this nature.


Conflict of interest statement

Competing Interests: The authors have declared that no competing interests exist.

Figures

Figure 1
Figure 1. SEA and SEH bind HLA-DR1 in solution.
(A) SEA-DR1 and SEH-DR1 complexes are SDS stable. Various Enterotoxins in the presence or absence of HLA-DR1/peptide complexes were incubated in PBS with a final SDS concentration of 0.1%, for 5 min at room temperature and subjected to electrophoresis in a 12% polyacrylamide gradient gel. The gel was silver stained by standard protocols. There was no evidence of multimer formation (*) Lane 1: empty DR1. Lane 2: DR1/HA306-318 complex. Lane 3: DR1/HAY308A complex. Lane 4: SEA+DR1/HAY308A Lane 5: SEA only Lane 6: SEA+DR1/HAY308A Lane 7: SEH only. (B) SEA-DR1 but not SEH-DR1 complexes can bind an additional DR1. A solution of DR1 was injected on a HA306-318 peptide decorated BIAcore CM5 chip (*) and allowed to dissociate for 3 minutes. A second injection (**) of preformed SEA-DR1 (red) resulted in a 30% greater RU change than SEH-DR1 (blue), as measured by the difference between the solid and dashed arrows. Two consecutive injections of DR1 alone on a control flow cell (inset) showed the same fold increase in RUs as SEH-DR1. ▴, start of injection.
Figure 2
Figure 2. SEA induces clustering of HLA-DR1 on the B cell surface.
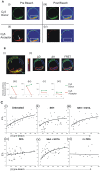
(A) Acceptor Photobleach experiments can quantitatively measure energy transfer. Images of B cells isolated from wtDR1 transgenic mice were stained with Donor (Cy3) and Acceptor (Cy5) conjugated anti-DR monoclonal antibodies (L243) at Donor∶Acceptor ratios of (1∶1) before (i, ii) and after (iii, iv) acceptor photobleaching, indicated by arrow. Donor channel, i, iii; acceptor channel, ii, iv. The photobleached area is boxed in the range indicator (to the right of each image). (B) FRET in the various regions of interest (ROI) on the cell surface (overlay, i) can be quantified from changes in the intensity in the Donor and Acceptor channels (ii). Acceptor photobleach (red) results in variable increase in Donor intensity (green; ROI 1, iii; ROI 1a, iv), while control ROIs 2 and 3 (v,vi) show little change in donor and acceptor intensities. (C) SEA induces clustering of HLA-DR1 on B cells. Energy Transfer (E%) values were plotted against acceptor Fluorescence ([A] pre-bleach) for untreated B cells (i), B cells treated with with SEH +/− EDTA (ii,iii), SEA in the presence of EDTA (iv) or B cells treated with 10 µg or 2.5 µg SEA (v,vi) for 45 minutes, here, at Donor∶Acceptor molar ratio 1∶4. Data from one of two experiments.
Figure 3
Figure 3. SEA does not mediate large-scale clustering of HLA-DR1 on B cells.
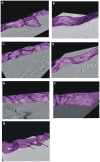
B cells treated as in Fig. 2 were stained using anti-HLA-DR primary and gold-labeled secondary antibodies, fixed and analyzed. Representative tomograms of 250 nm thick sections of these cells were generated and segmented to highlight the 3D distribution of DR1 labeled by 6 nm gold beads (gold spheres) on the B cell membrane (purple). B cells were untreated (A), treated with SEA+Zn2+ (B), SEA+EDTA (C) or SEH (D). Representative stretches of cell membrane with a higher density of DR1 in cells treated with SEA (E), or untreated B cells (F) also showed no aggregates. Forced crosslinking of DR1 (G) caused aggregation (capping) of DR1 in some areas (black arrow/asterisk) but not others (white arrowhead).
Figure 4
Figure 4. SEA induces small clusters of HLA-DR1 on the B cell surface.
B cells were treated, stained and fixed as in Figure 3, and thin sections (80 nm) analyzed by transmission electron microscopy. (A) Images of untreated B cells (i) or B cells treated with 2.5 µg SEA (ii) showed varying degrees of clustering of HLA-DR1. arrow/asterisk, “clustered” gold beads; arrowhead, “unclustered” gold beads. (B) Nearest neighbor analysis of B cells treated with SEA (red) shows an increased number of closely apposed gold beads compared to B cells treated with no enterotoxin (yellow) or SEH (blue). SEA+EDTA (green) has an intermediate distribution, and these differences disappear when nearest neighbors are separated by large distances. ▴, separation at 75 nm. (C) B cells treated with SEA show a statistically significant increase in the fraction of beads that are within 75 nm of each other, when compared to cells that were untreated or treated with SEH or SEA+EDTA. Same color scheme as above. (D) SEA treatment does not mediate higher order aggregation of HLA-DR1. Equivalent stretches of B cell membranes of various groups were evaluated for number of instances of “higher order” clusters (clusters of >2 gold beads). There was an increase in the fraction of cells with higher order clusters on SEA treatment, but no dramatic change in the distribution profile between the groups. Data pooled from two experiments.

References

    1. Choi YW, Kotzin B, Herron L, Callahan J, Marrack P, et al. Interaction of Staphylococcus aureus toxin “superantigens” with human T cells. Proc Natl Acad Sci U S A. 1989;86:8941–8945. - PMC - PubMed
    1. Proft T, Fraser JD. Bacterial superantigens. Clin Exp Immunol. 2003;133:299–306. - PMC - PubMed
    1. Fast DJ, Schlievert PM, Nelson RD. Toxic shock syndrome-associated staphylococcal and streptococcal pyrogenic toxins are potent inducers of tumor necrosis factor production. Infect Immun. 1989;57:291–294. - PMC - PubMed
    1. Miethke T, Wahl C, Heeg K, Echtenacher B, Krammer PH, et al. T cell-mediated lethal shock triggered in mice by the superantigen staphylococcal enterotoxin B: critical role of tumor necrosis factor. J Exp Med. 1992;175:91–98. - PMC - PubMed
    1. Fraser JD. High-affinity binding of staphylococcal enterotoxins A and B to HLA-DR. Nature. 1989;339:221–223. - PubMed

Publication types