. 2009 Jul 9:2:42.
doi: 10.1186/1755-8794-2-42.

Genomic profiling distinguishes familial multiple and sporadic multiple meningiomas

Affiliations

Genomic profiling distinguishes familial multiple and sporadic multiple meningiomas

Yiping Shen et al. BMC Med Genomics. .

Abstract

Background: Meningiomas may occur either as familial tumors in two distinct disorders, familial multiple meningioma and neurofibromatosis 2 (NF2), or sporadically, as either single or multiple tumors in individuals with no family history. Meningiomas in NF2 and approximately 60% of sporadic meningiomas involve inactivation of the NF2 locus, encoding the tumor suppressor merlin on chromosome 22q. This study was undertaken to establish whether genomic profiling could distinguish familial multiple meningiomas from sporadic solitary and sporadic multiple meningiomas.

Methods: We compared 73 meningiomas presenting as sporadic solitary (64), sporadic multiple (5) and familial multiple (4) tumors using genomic profiling by array comparative genomic hybridization (array CGH).

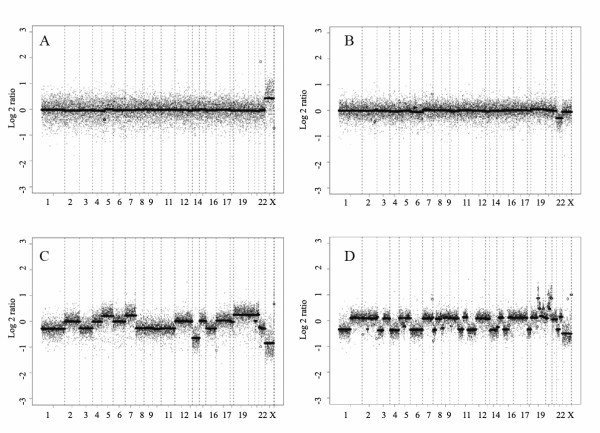
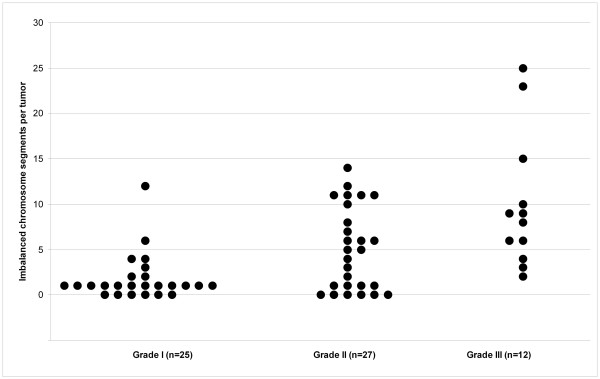
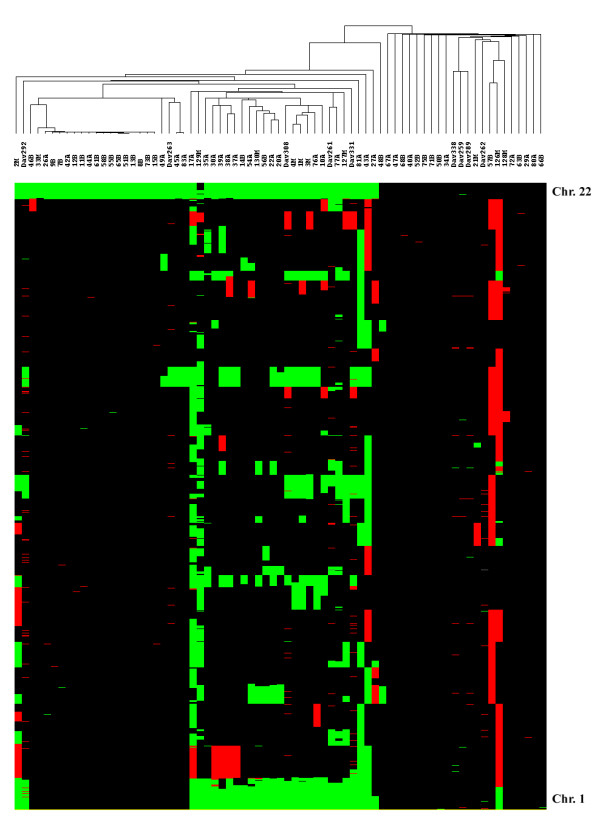
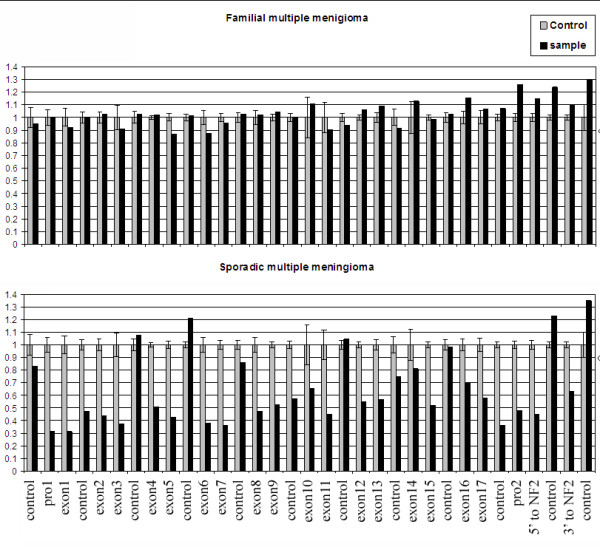
Results: Sporadic solitary meningiomas revealed genomic rearrangements consistent with at least two mechanisms of tumor initiation, as unsupervised cluster analysis readily distinguished tumors with chromosome 22 deletion (associated with loss of the NF2 tumor suppressor) from those without chromosome 22 deletion. Whereas sporadic meningiomas without chromosome 22 loss exhibited fewer chromosomal imbalance events overall, tumors with chromosome 22 deletion further clustered into two major groups that largely, though not perfectly, matched with their benign (WHO Grade I) or advanced (WHO Grades II and III) histological grade, with the latter exhibiting a significantly greater degree of genomic imbalance (P < 0.001). Sporadic multiple meningiomas showed a frequency of genomic imbalance events comparable to the atypical grade solitary tumors. By contrast, familial multiple meningiomas displayed no imbalances, supporting a distinct mechanism for the origin for these tumors.

Conclusion: Genomic profiling can provide an unbiased adjunct to traditional meningioma classification and provides a basis for exploring the different genetic underpinnings of tumor initiation and progression. Most importantly, the striking difference observed between sporadic and familial multiple meningiomas indicates that genomic profiling can provide valuable information for differential diagnosis of subjects with multiple meningiomas and for considering the risk for tumor occurrence in their family members.


Figures

Figure 1
Figure 1
Representative array CGH profiles of meningiomas. Segmentation analysis of array CGH results generated from Agilent cDNA arrays using four representative sporadic solitary meningiomas is shown: A: Benign meningioma (68B) without imbalanced chromosome segments (ICS). The X chromosome imbalance is due to use of a sex-mismatched standard DNA as a positive control; B: Meningioma with chromosome 22 deletion as the only imbalance event (42A); C: Atypical meningioma with both gain and loss ICS (43A); D: Malignant meningioma with many ICS and focal amplification (129M). X-axis: clones are ordered from chromosome 1 to 22, X and Y and within each chromosome, clones are arranged following their physical map order from short arm telomere to long arm telomere. Y-axis: log2 ratio (test/control) of array CGH signal for each individual probe (scattered dots) and for segments of consistent dosage (solid lines) defined by binary segmentation. The baseline (no copy number change) is 0; segments above the baseline indicate gain of copy number and segments below the baseline indicate loss of copy number.
Figure 2
Figure 2
The distribution of Imbalanced Chromosome Segments in three groups of sporadic solitary meningiomas. Each dot represents an individual tumor. Y-axis indicates the total number of imbalanced chromosome segments (ICS) in each tumor; X-axis shows three groups of meningioma of different grades. The total number of ICS ranges from 0–12 in benign meningiomas, 0–14 in atypical meningiomas and 2–25 in malignant meningiomas.
Figure 3
Figure 3
Tree view of unsupervised hierarchical cluster analysis of meningiomas based upon array CGH data. A cluster diagram generated using array CGH data from Agilent cDNA array analysis of 63 sporadic solitary meningiomas, 5 sporadic multiple meningiomas and 4 familial multiple meningiomas is shown above a HEAT map showing the occurrence of imbalanced chromosome segments (ICS) (green = loss; red = gain as defined in Methods) relative to control DNA observed across the genome from chromosome 22 (top) through chromosome 1 (bottom). The dataset segregated into two branches based upon chromosome 22 deletion status, with tumors deleted for chromosome 22 on the left and tumors without chromosome 22 deletion on the right. Of the sporadic multiple meningiomas, DAV331, DAV308 and DAV292 are from the same person (but do not show identical ICS patterns) and DAV261 and DAV263 are each from different subjects; of the familial multiple meningiomas, DAV259 and DAV262 are each from different individuals in two different families while DAV289 and DAV338 are from the same subject, representing a third family.
Figure 4
Figure 4
MLPA analysis of sporadic and familial multiple meningiomas. Representative MLPA analyses of a familial multiple meningioma (DAV338, top panel) and a sporadic multiple meningioma (DAV308, bottom panel) are shown with probe IDs on the X-axis. There are 21 MLPA probes for the NF2 gene (one probe for each exon, two probes for the promotor region and one probe on either side of the gene) and 12 control probes located on other chromosomes. The Y-axis shows the relative probe peak height as an indication of copy number. The relative peak heights were calculated by normalizing the peak height of control probes between normal control DNA and tumor DNA. Gray bars indicate the mean peak height with standard deviation from 10 normal control DNAs. Black bars indicate the peak height for the tested tumor DNA. The top panel reveals no deletion of the NF2 gene while the bottom panel is consistent with deletion of one copy of the NF2 gene, including its flanking regions. All multiple meningiomas and a sampling of 10 sporadic solitary meningiomas were tested by MLPA, with results at this locus identical to those from array CGH.

References

    1. CBTRUS . Statistical Report: Primary Brain Tumors in the United States, 2000–2004. Published by the Central Brain Tumor Registry of the United States.; USA; 2008.
    1. DeAngelis LM. Medical Progress: Brain Tumors. New England Journal of Medicine. 2001;344:114–123. doi: 10.1056/NEJM200101113440207. - DOI - PubMed
    1. Louis DN, Ohgaki H, Wiestler OD, Cavenee WK. WHO Classification of tumours of the central nervous system. Lyon: IARC; 2007. - PMC - PubMed
    1. Evans DG, Huson SM, Donnai D, Neary W, Blair V, Newton V, Harris R. A clinical study of type 2 neurofibromatosis. Q J Med. 1992;84:603–618. - PubMed
    1. Trofatter JA, MacCollin MM, Rutter JL, Murrell JR, Duyao MP, Parry DM, Eldridge R, Kley N, Menon AG, Pulaski K, et al. A novel moesin-, ezrin-, radixin-like gene is a candidate for the neurofibromatosis 2 tumor suppressor. Cell. 1993;72:791–800. doi: 10.1016/0092-8674(93)90406-G. - DOI - PubMed