. 2009 Oct;86(4):1007-16.
doi: 10.1189/jlb.0309203. Epub 2009 Jul 9.

Hyperactivated B cells in human inflammatory bowel disease

Affiliations

Hyperactivated B cells in human inflammatory bowel disease

Ansu Mammen Noronha et al. J Leukoc Biol. 2009 Oct.

Abstract

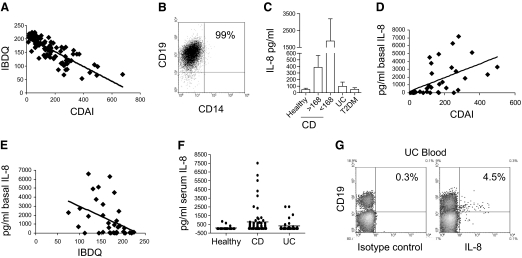
IBD is characterized by a chronic, dysregulated immune response to intestinal bacteria. Past work has focused on the role of T cells and myeloid cells in mediating chronic gastrointestinal and systemic inflammation. Here, we show that circulating and tissue B cells from CD patients demonstrate elevated basal levels of activation. CD patient B cells express surface TLR2, spontaneously secrete high levels of IL-8, and contain increased ex vivo levels of phosphorylated signaling proteins. CD clinical activity correlates directly with B cell expression of IL-8 and TLR2, suggesting a positive relationship between these B cell inflammatory mediators and disease pathogenesis. In contrast, B cells from UC patients express TLR2 but generally do not demonstrate spontaneous IL-8 secretion; however, significant IL-8 production is inducible via TLR2 stimulation. Furthermore, UC clinical activity correlates inversely with levels of circulating TLR2+ B cells, which is opposite to the association observed in CD. In conclusion, TLR2+ B cells are associated with clinical measures of disease activity and differentially associated with CD- and UC-specific patterns of inflammatory mediators, suggesting a formerly unappreciated role of B cells in the pathogenesis of IBD.


Figures

Figure 1.
Figure 1.
Circulating B cells from CD patients secrete IL-8 constitutively. (A) Correlation between CDAI and IBDQ; n = 85, r = −0.8629, P < 0.0001. Purified B cells (B) were cultured in the absence of stimulation for 18 h, and cell-free supernatants were evaluated for levels of IL-8. (C) IL-8 secretion by B cells from healthy donors in pg/ml (n=16; mean 80.8±37.8), patients with more mild disease (IBDQ above 168; n=18; mean 533.7±208), patients with moderate to severe disease (IBDQ below 168; n=18; mean 2767±713), UC patients (n=14; mean 106.7±45.5), or T2DM patients (n=6; 53.1±23). The difference between IL-8 secretion by B cells from sick CD patients and all other samples was highly significant (P<0.0001). There was no significant difference between IL-8 secretion by healthy B cells and UC or T2DM B cells. IL-8 concentrations are expressed as median and interquartile range. (D) The level of constitutive IL-8 produced by CD B cells is correlated with CDAI (n=33, r=0.5233, P=0.002). A higher CDAI indicates increased disease activity. (E) The level of constitutive IL-8 produced by CD B cells is inversely correlated with IBDQ (n=35, r=–0.4161, P=0.012). A lower IBDQ value indicates increased disease activity and hence a poorer quality of life. (F) Serum concentrations of IL-8 in healthy (n=20; mean 88.1±51.6) and CD (n=60; mean 781±200) and UC patients (n=30; 328±126.9). Healthy versus CD: P < 0.001; CD versus UC: P< 0.05; and UC versus healthy values were not significantly different. (G) CD19+ B cells in fresh whole blood from UC patients were subjected to intracellular staining analysis for IL-8 (right) compared with isotype control (left). Shown are cells gated on the lymphocyte population on FSC/SSC and are representative of data from five UC patients. Note: Sample sizes vary for different tests as a result of the unavailability of certain patient samples.
Figure 2.
Figure 2.
Circulating B cells from IBD patients demonstrate signatures of constitutive activation. (A) Fold change in gene expression in freshly isolated B cells from CD patients (n=4) compared with healthy donors [n=4; *, P<0.05, compared with hypoxanthine guanine phosphoribosyl transferase 1 (HPRT1)]. (B) Levels of phospho-kinase+ B cells in fresh whole blood. Healthy blood sample demonstrating a low level of phospho-Btk (left panel) and CD sample demonstrating an increased level of phospho-Btk (middle panel) and -Syk (right panel). (C) Composite data demonstrating that phosphorylated ERK1/2 is elevated in healthy (n=5) and patient blood B cells (CD: n=16; UC: n=6). Phosphorylated-p38 and -Syk are detected in UC and CD B cells. Increased phosphorylated-Btk is detected in CD patient B cells and increased over UC patients. Data are presented as the mean percentage of B cells positive ± sd; *, P = 0.03. (D) Stratification of phospho-protein levels by disease activity in CD. p38: IBDQ > 168, n = 7, IBDQ < 168, n = 7; Syk: IBDQ > 168, n = 9, IBDQ < 168, n = 6; Btk: IBDQ > 168, n = 7, IBDQ < 168, n = 9; *, P = 0.01.
Figure 3.
Figure 3.
An increased percentage of B cells from IBD patients express TLR2. B cells in fresh whole blood were evaluated for expression of TLR2 by flow cytometry. (A) Gates are drawn using anti-CD19 and isotype control (left panel). Other panels show representative TLR2 analysis from a healthy donor (middle panel) or patient with severe disease (right panel). Plots were generated using the lymphocyte gate on FSC/SSC [38]. (B) Composite data of TLR2+ B cell percentages of healthy donors (n=46; mean 8.3±5.1 sd), CD patients (n=100; mean 27.7±22.4; P<0.001 compared with healthy donors), UC patients (n=30; 19.2±15.3; P<0.05 compared with healthy donors); T2DM patients (n=15; mean 5.4±4.4; P>0.05 compared with healthy donors). (C) Interaction between transcription factors (PU.1, shaded bars; cJun, open bars) and the TLR2 promoter in B cells from healthy donors and CD patients. (D) Interaction between transcription factors (PU.1, shaded bars; cJun, open bars) and the TLR2 promoter in resting and stimulated monocytes, which were stimulated with 100 ng/ml E. coli LPS for 2 h prior to analysis. Bars are averages ± sd from three independent determinations. (E) Cross-sectional percentages of TLR2+ B cells correlate with corresponding values of CDAI (n=100, r=0.4346, P=0.0003). A higher CDAI indicates more severe disease. (F) Percentages of TLR2+ B cells correlate inversely with the IBDQ, where a higher value represents a better quality of life (n=100, r=–0.4025, P=0.0075). These data indicate that the level of TLR2+ B cells predicts disease severity for CD patients. (G). Percentages of TLR2+ B cells are positively correlated with the IBDQ in UC patients (n=26, r=0.4418, P=0.024). These data indicate that levels of TLR2+ B cells expand during periods of quiescent disease in UC.
Figure 4.
Figure 4.
TLR2 stimulation induces significant IL-8 secretion from circulating B cells from IBD patients. (A) Purified B cells were cultured in the presence of 1 μg/ml of the TLR2 ligand Pam3CSK4 for 18 h, and cell-free supernatants were evaluated for IL-8 concentrations. IL-8 secretion by B cells from healthy patients in pg/ml (n=12; mean 274±114), relatively well CD patients (IBDQ>168; n=19; mean 1227±456), sick CD patients (IBDQ<168; n=20; mean 2991±638), UC patients (n=13; mean 1244±415), and tonsil B cells from tonsillitis patients (n=11, mean 254±97). The difference between IL-8 secretion by B cells from healthy donors versus sick CD patients is P = 0.001. The difference between B cells from healthy donors versus other samples is not significant. IL-8 concentrations are expressed as median and interquartile range. (B) Kinetics of IL-8 secretion. Purified circulating B cells from patients with IBDQ < 168 were cultured in the presence of Pam3CSK4 for 1–6 days, and cell-free supernatants were evaluated for IL-8 levels (n=3–4 for each time-point). Data are presented as mean IL-8 concentrations pg/ml ± sd.
Figure 5.
Figure 5.
B cells express elevated levels of TLR2 in inflamed gastrointestinal tissue. MCs were isolated from mucosal tissues and evaluated by flow cytometry for TLR2 expression on CD19+ B cells from (A) healthy adjacent tissue (appendix; left plot) or inflamed ileum from a CD patient (middle plot). (Note: Plots are generated with the lymphocyte gate on FSC/SSC, which do not contain monocytes or granulocytes.) Representative of four patient samples. The CD19low/TLR2 high population (middle plot) consists of CD77+ B cells consistent with a GC phenotype (right plot). (B) Quantification of percentages of TLR2+ B cells in gastrointestinal tissues. Tissues were from patients with CD (n=4) and UC (n=4), and appendicitis tissues were from patients with appendicitis without IBD (n=7). Healthy tissues are a combination from CD and UC patients (n=8). (C) Intracellular IL-8 in gastrointestinal CD19+ B cells from adjacent healthy (left plot) and diseased colon (right plot) from a UC patient. (D) Intracellular IL-8 from acutely inflamed appendicitis tissue. Shaded, Isotype control; black line, anti-IL-8. Cells are gated on the lymphocyte population as above and are representative of five tissue samples.
Figure 6.
Figure 6.
TLR2 levels are specifically reflective of gastrointestinal activity and quality of life. (A) Percentages of TLR2+ B cells were plotted against measures of systemic inflammation, ESR (n=65; P=0.899) and (B) CRP (n=71; P=0.749). No correlation was found. (C) Changes in TLR2+ B cells percentages are reflected in a patient’s IBDQ score. Each line represents a single CD patient (n=5) and represents 5–9 months of time difference between points. (D) Longitudinal changes in TLR2 and IBDQ in three CD patients followed between 6 and 12 months. Values within plots are IBDQ values. An increase in the quality of life is reflected by a decrease in TLR2+ B cells.

References

    1. Loftus E V., Jr Clinical epidemiology of inflammatory bowel disease: incidence, prevalence, and environmental influences. Gastroenterology. 2004;126:1504–1517. - PubMed
    1. Baumgart D C, Carding S R. Inflammatory bowel disease: cause and immunobiology. Lancet. 2007;369:1627–1640. - PubMed
    1. Yamamoto-Furusho J K, Podolsky D K. Innate immunity in inflammatory bowel disease. World J Gastroenterol. 2007;13:5577–5580. - PMC - PubMed
    1. Rakoff-Nahoum S, Medzhitov R. Role of Toll-like receptors in tissue repair and tumorigenesis. Biochemistry (Mosc) 2008;73:555–561. - PubMed
    1. Cario E, Gerken G, Podolsky D K. Toll-like receptor 2 controls mucosal inflammation by regulating epithelial barrier function. Gastroenterology. 2007;132:1359–1374. - PubMed

Publication types

MeSH terms