. 2009 Jul 24;325(5939):435-9.
doi: 10.1126/science.1173288. Epub 2009 Jul 9.

Dependence of mouse embryonic stem cells on threonine catabolism

Affiliations

Dependence of mouse embryonic stem cells on threonine catabolism

Jian Wang et al. Science. .

Abstract

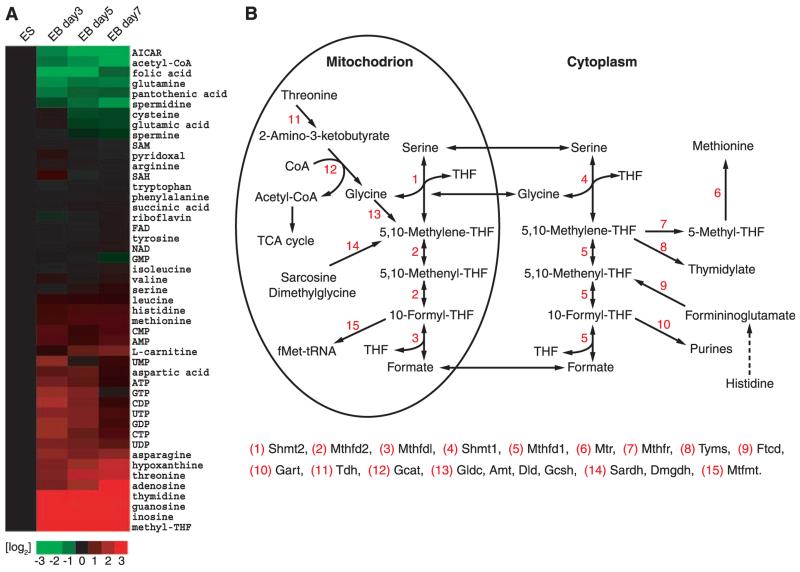
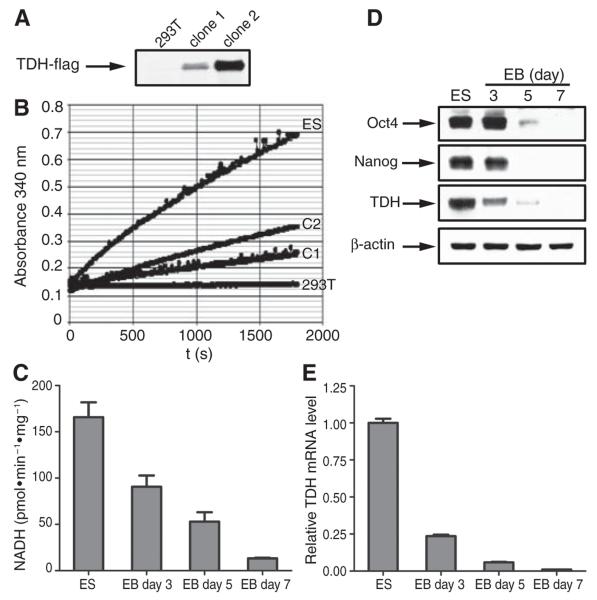
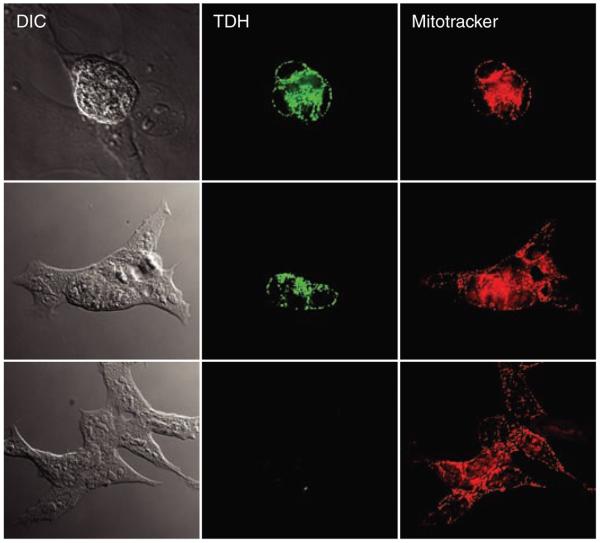
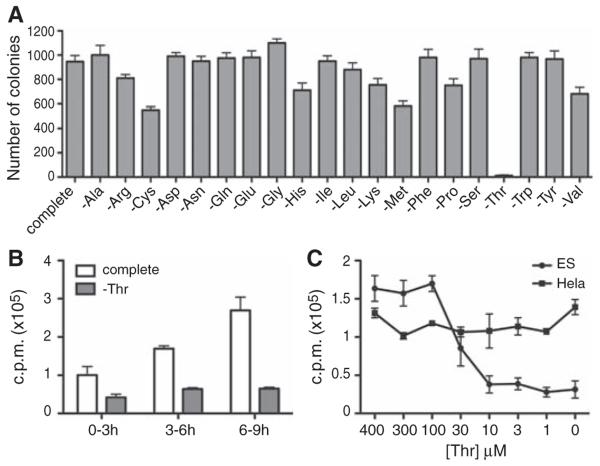
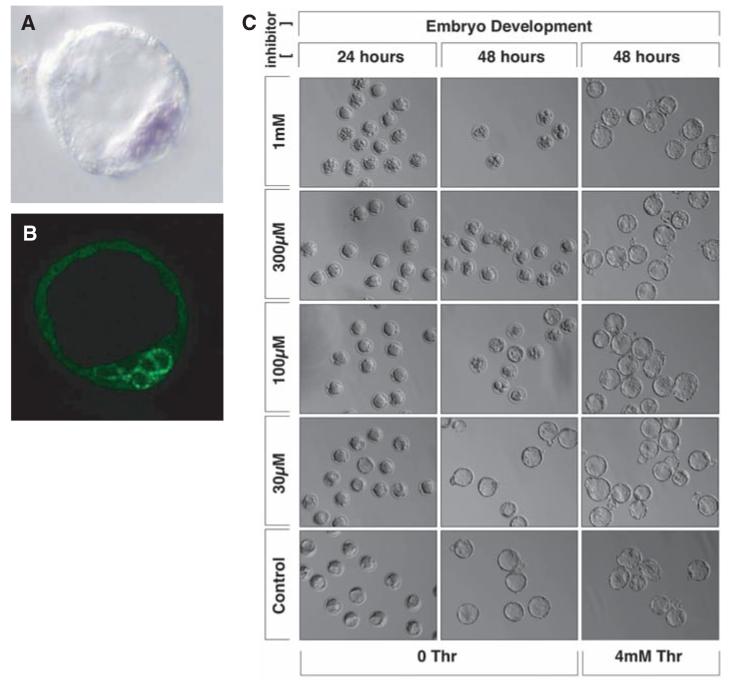
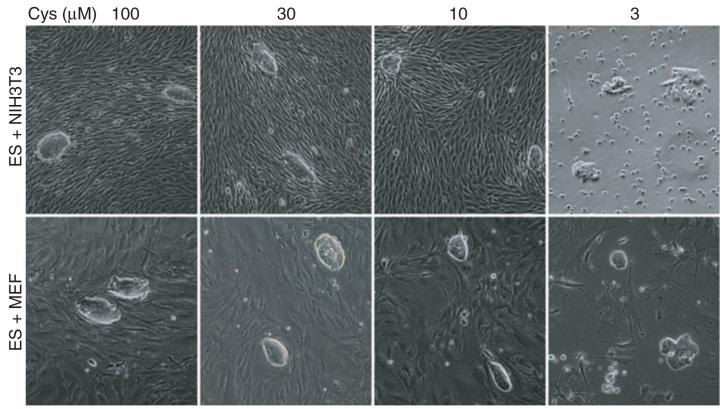
Measurements of the abundance of common metabolites in cultured embryonic stem (ES) cells revealed an unusual state with respect to one-carbon metabolism. These findings led to the discovery of copious expression of the gene encoding threonine dehydrogenase (TDH) in ES cells. TDH-mediated catabolism of threonine takes place in mitochondria to generate glycine and acetyl-coenzyme A (CoA), with glycine facilitating one-carbon metabolism via the glycine cleavage system and acetyl-CoA feeding the tricarboxylic acid cycle. Culture media individually deprived of each of the 20 amino acids were applied to ES cells, leading to the discovery that ES cells are critically dependent on one amino acid--threonine. These observations show that ES cells exist in a high-flux backbone metabolic state comparable to that of rapidly growing bacterial cells.


Figures

Fig. 1
Fig. 1
Coordinated changes in metabolite abundance during ES cell differentiation. Metabolites extracted from cells in 50% aqueous methanol were subjected to LC-MS/MS analysis (4). (A) Heat map showing the relative levels of metabolites in ES cells as a function of 3, 5, and 7 days after withdrawal of LIF and differentiation into embryoid bodies. Metabolite levels are expressed as log2 transformation of the fold change at days 3, 5, and 7 relative to the same measurement in undifferentiated ES cells; green indicates metabolites that decrease in abundance as a function of differentiation and red, metabolites that increase as ES cells differentiate. (B) Schematic diagram of the pathways facilitating folate-mediated, one-carbon metabolism.
Fig. 2
Fig. 2
Measurements of TDH enzyme activity, mRNA abundance, and protein abundance as a function of ES cell differentiation. (A) Western blotting assays of 293T cells stably transformed with an expression vector encoding a Flag-tagged version of TDH. Western blotting revealed no TDH signal in parental 293T cells, an intermediate signal in transformed clone 1, and a higher signal in transformed clone 2. (B) TDH enzyme activity assays for ES cells (ES), untransformed 293T cells (293T), transformed 293T clone 1 cells (C1), and transformed 293T clone 2 cells (C2). Mitochondria were isolated from ES cells and the three 293T clones by differential centrifugation (see Materials and Methods). Equal amounts (10 μg) of mitochondrial protein were subjected to an assay reaction containing 100 mM tris–HCl (pH 8.0), 50 mM NaCl, 25 mM threonine, and 5 mM NAD+ at 25°C. Absorbance at 340 nm was recorded over time on a microplate reader to monitor conversion of NAD+ to NADH. (C) TDH enzyme activity present in mitochondrial extracts from undifferentiated ES cells and day 3,5, and 7 embryoid body cells as determined under the same reaction conditions as in (B). Experiments were performed in triplicate; error bars indicate ±SD. (D) Western blotting signals for Oct4, Nanog, TDH, and actin in protein samples prepared from undifferentiated ES cells and day 3, 5, and 7 embryoid body cells. (E) shows TDH mRNA levels as monitored by qPCR in ES cells and day 3, 5, and 7 embryoid body cells. Experiments were performed in triplicate; error bars indicate ±SD.
Fig. 3
Fig. 3
Immunohistochemical staining of TDH in mouse ES cells as a function of differentiation. Mouse ES cells were grown in chamber slides and subjected to LIF withdrawal–mediated differentiation. Shown are images of an undifferentiated ES colony (top), a partially differentiated colony (middle), and an extensively differentiated colony (bottom). Cells were fixed and stained with antibodies specific to the mouse TDH enzyme. TDH immunoreactivity was visualized with Alexa488-labeled goat antibody to rabbit secondary antibodies (green). Before fixation, cells were incubated with Mitotracker dye, allowing visual localization of mitochondria (red).
Fig. 4
Fig. 4
Inhibition of cell growth and DNA synthesis in ES cells deprived of threonine. (A) Growth dependence of ES cells on threonine supplementation to culture media. After plating at single-cell density and growth on gelatinized dishes for 6 hours, E14Tg2A mouse ES cells were exposed for 36 hours to complete culture medium or to medium missing a single amino acid. The numbers of alkaline phosphatase–positive colonies were counted and plotted. The experiments were performed in triplicate; error bars indicate±SD. (B)Time-dependent effects of threonine deprivation on DNA synthesis in cultured ES cells. After growth of undifferentiated ES cells in complete culture medium for 1 day, 2 × 10⁵ cells were exposed to complete (white bar) or threonine-deprived (gray bar) medium for 3, 6, or 9 hours. Cells were metabolically labeled with 2 μCi of [3H]thymidine at 3-hour intervals as indicated (see Materials and Methods). Progressively increased amounts of label incorporation at 6 and 9 hours were observed for cells grown in complete culture medium, reflective of increased cell number owing to a 5-hour doubling time. Experiments were performed in triplicate; error bars indicate ±SD. (C) Dose-dependent effects of threonine deprivation on DNA synthesis in cultured ES cells. ES cells (2 × 10⁵) (closed circle) or HeLa cells (5 × 10⁵) (closed square) were exposed for 3 hours to culture medim containing the indicated concentrations of threonine, and then metabolically labeled for 3 hours with [3H]thymidine. DNA was purified from each sample and the amount of radioactivity incorporated was measured by scintillation counting. Experiments were performed in triplicate; error bars indicate ±SD.
Fig. 5
Fig. 5
3-Hydroxynorvaline arrests the early development of mouse embryos. Blastocyst-stage mouse embryos were assayed by in situ hybridization to localize TDH mRNA (A) and immunohistochemical staining with antibodies specific to the TDH enzyme (B). In situ and antibody staining signals localized the TDH mRNA (purple) and enzyme (green) to cells associated with the ICM. Precompacted morula-stage embryos were incubated in varying concentrations of the threonine analog 3-HNV. Embryos exposed to 1 mM and 300 μM 3-HNV were blocked from forming cavitated blastocysts (C). Incubation with 4 mM threonine resulted in complete rescue of embryonic development even at the highest concentration (1 mM) of 3-HNV.
Fig. 6
Fig. 6
Effects of cysteine deprivation on the growth of ES, MEF, and 3T3 cells. Cocultures of ES/MEF or ES/3T3 cells were subjected for 2 days to media containing varying amounts of supplemented cysteine. Cysteine deprivation severely impeded MEF cell growth at 10 and 3 μM and 3T3 growth at 3 μM (see also fig. S5). Although colony morphology was altered under the most severe conditions of cysteine deprivation, ES cell colonies were observed under all culture conditions tested.

References

    1. Alberts B, et al. Molecular Biology of the Cell. ed. 5 Garland, New York: 2007. p. 1.
    1. Snow MHL. J. Embryol. Exp. Morphol. 1977;42:293.
    1. Smith AG. Annu. Rev. Cell Dev. Biol. 2001;17:435. - PubMed
    1. Tu BP, et al. Proc. Natl. Acad. Sci. U.S.A. 2007;104:16886. - PubMed
    1. Warren L, Buchanan JM. J. Biol. Chem. 1957;229:613. - PubMed

Publication types