Comparative Study
. 2009 Oct;62(4):868-79.
doi: 10.1002/mrm.22086.

In vivo 1H NMR spectroscopy of the human brain at high magnetic fields: metabolite quantification at 4T vs. 7T

Affiliations
Comparative Study

In vivo 1H NMR spectroscopy of the human brain at high magnetic fields: metabolite quantification at 4T vs. 7T

Ivan Tkác et al. Magn Reson Med. 2009 Oct.

Abstract

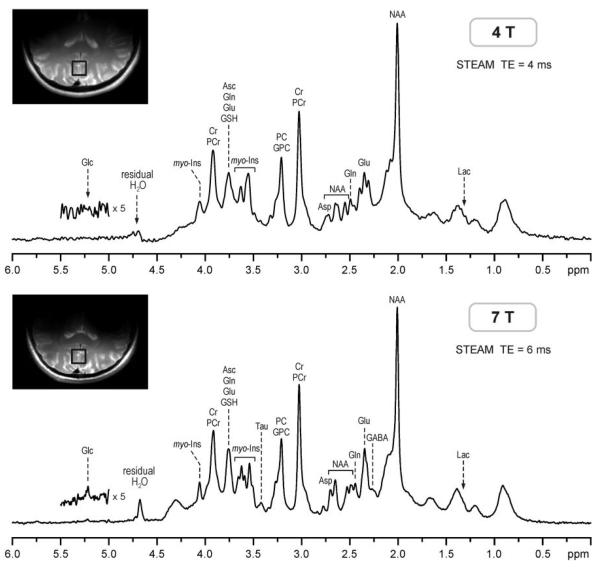
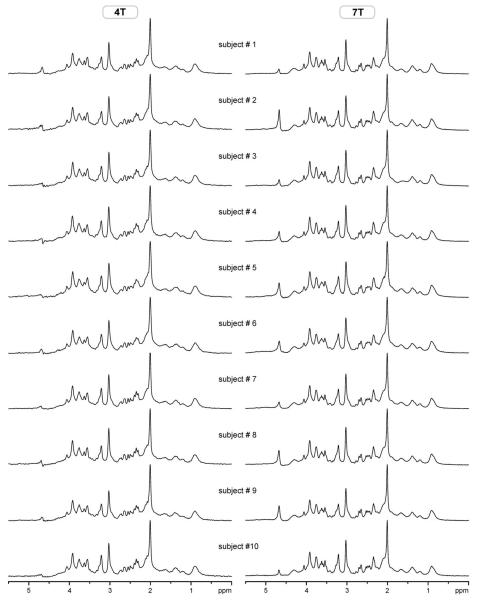
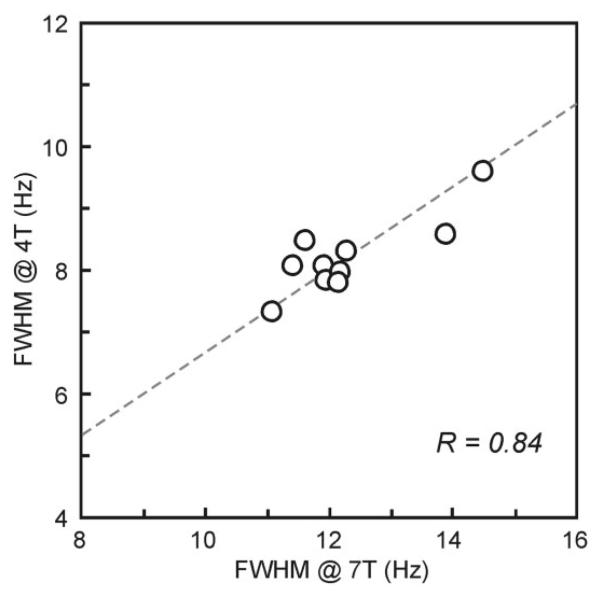
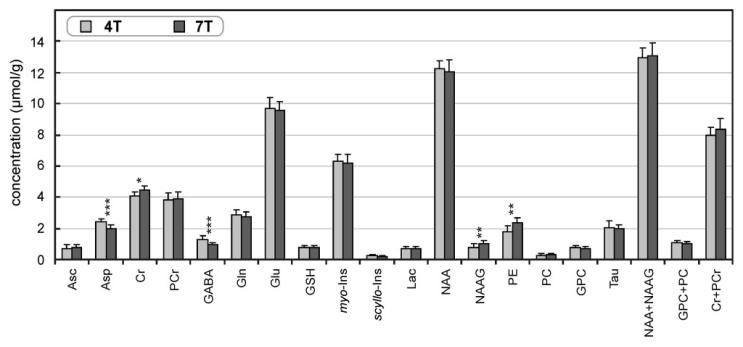
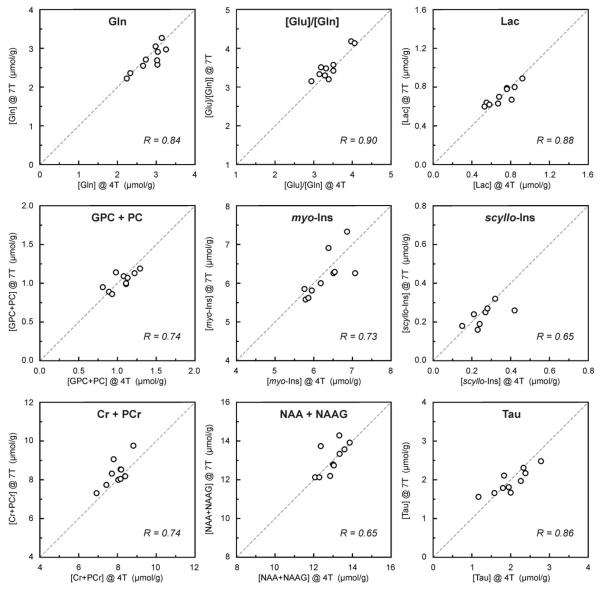
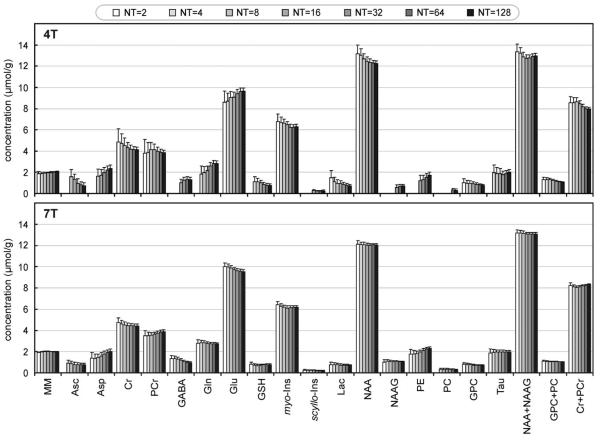
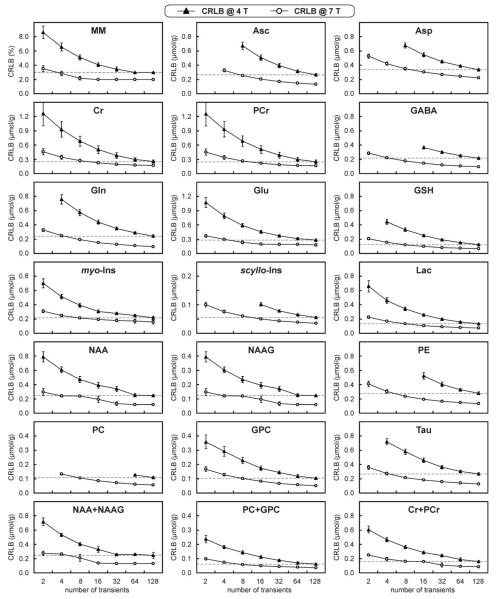
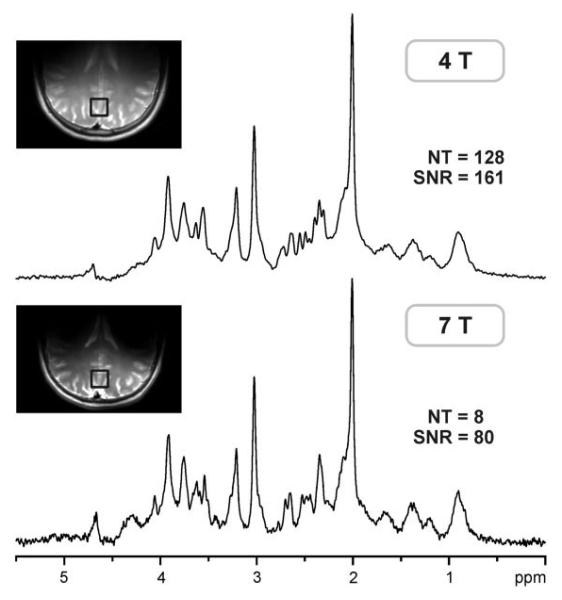
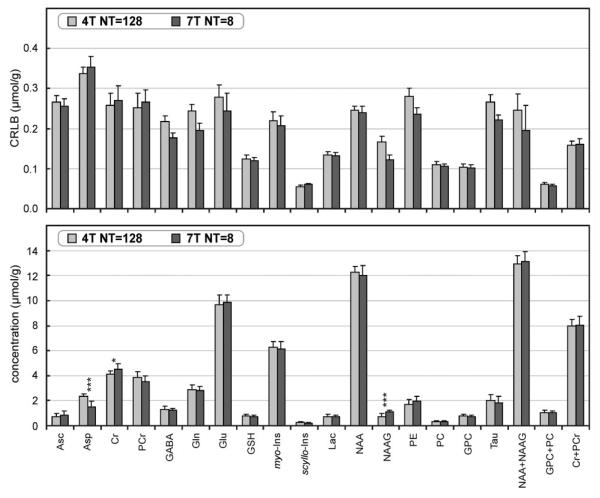
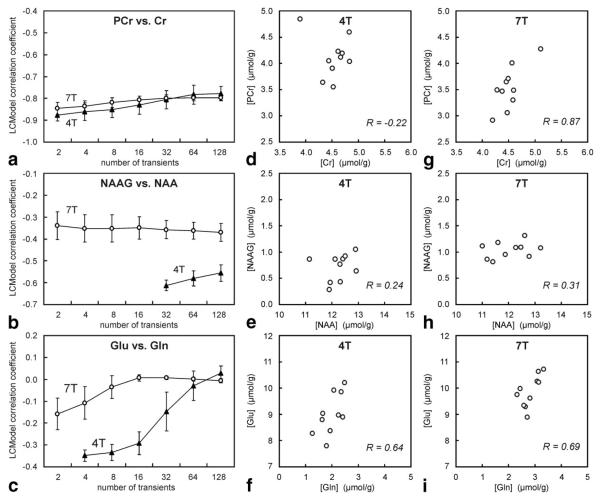
A comprehensive comparative study of metabolite quantification from the human brain was performed on the same 10 subjects at 4T and 7T using MR scanners with identical consoles, the same type of RF coils, and identical pulse sequences and data analysis. Signal-to-noise ratio (SNR) was increased by a factor of 2 at 7T relative to 4T in a volume of interest selected in the occipital cortex using half-volume quadrature radio frequency (RF) coils. Spectral linewidth was increased by 50% at 7T, which resulted in a 14% increase in spectral resolution at 7T relative to 4T. Seventeen brain metabolites were reliably quantified at both field strengths. Metabolite quantification at 7T was less sensitive to reduced SNR than at 4T. The precision of metabolite quantification and detectability of weakly represented metabolites were substantially increased at 7T relative to 4T. Because of the increased spectral resolution at 7T, only one-half of the SNR of a 4T spectrum was required to obtain the same quantification precision. The Cramér-Rao lower bounds (CRLB), a measure of quantification precision, of several metabolites were lower at both field strengths than the intersubject variation in metabolite concentrations, which resulted in a strong correlation between metabolite concentrations of individual subjects measured at 4T and 7T.


Figures

FIG. 1
FIG. 1
1H NMR spectra acquired at 4T and 7T from the brain of the same subject. STEAM, TE = 4 ms (4T), TE = 6 ms (7T), TR = 5 s, VOI = 8cm3, NT = 160. Processing: frequency and phase correction of single-scan FID arrays, FID summation, correction for the residual eddy currents, Gaussian multiplication (σ = 0.15 s), FT, zero-order phase correction. SNR = 149 (4T), SNR = 303 (7T). Insets: transverse RARE images of the brain with the position of the VOI on the midline in the occipital lobe.
FIG. 2
FIG. 2
In vivo 1H NMR spectra of 10 healthy subjects measured at 4T and 7T. Data acquisition and processing parameters were the same as in Fig. 1. No water signal removal or baseline corrections were applied. Average SNR = 154 (4T), SNR = 307 (7T).
FIG. 3
FIG. 3
Correlation between water signal linewidths of individual subjects achieved at 4T and 7T. Gray matter–rich occipital cortex, VOI = 8 cm3, see Fig. 1 for the location.
FIG. 4
FIG. 4
Comparison of neuro-chemical profiles determined at 4T and 7T from gray-matter–rich occipital cortex of 10 healthy volunteers (age = 24 ± 5 years). 1H NMR spectra with NT = 160, error bars = SD, significance level: *P < 0.05, **P < 0.01, ***P < 0.001.
FIG. 5
FIG. 5
Correlation between metabolite concentrations of individual subjects determined from 4T and 7T spectra (NT = 160).
FIG. 6
FIG. 6
Metabolite concentrations determined at 4T and 7T from spectra with number of transients ranging from 2 to 128. Number of subjects = 10, number of spectra per subject: 10 spectra with NT = 2, 10 × NT = 4, 10 × NT = 8, 10 × NT = 16, 5 × NT = 32, 2 × NT = 64, 1 × NT = 128. Error bars: average Cramér-Rao lower bounds. Metabolites such as GABA, scyllo-Ins, NAAG, and PC were not detected from spectra with lower number of transients at 4T (CRLB > 50%). Macromolecules (MM) are quantified in arbitrary units.
FIG. 7
FIG. 7
Comparison of Cramér-Rao lower bounds (CRLBs) of brain metabolites and fast-relaxing macromolecules (MM) between 4T and 7T as a function of the number of transients. Number of subjects and number of spectra per subject are the same as in Fig. 6. Error bars = SD. Horizontal lines represent the CRLB achieved with NT = 128 at 4T.
FIG. 8
FIG. 8
Representative 1H NMR spectra of one subject measured at 4T with 128 transients and at 7T with eight transients. Insets: transverse RARE images of the brain with the position of the VOI on the midline in the occipital lobe.
FIG. 9
FIG. 9
Concentrations of brain metabolites and corresponding CramérRao lower bounds quantified by LC-Model analysis from spectra measured at 4T with 128 transients and at 7T with eight transients. Number of subjects = 10, number of spectra per subject and field strength = 1, error bars = SD, significance level: *P < 0.05, ***P < 0.001.
FIG. 10
FIG. 10
Comparison of correlation coefficients of selected pairs of metabolites estimated by LCModel analysis of 4T and 7T spectra (ac) with the correlation between the concentrations of these metabolites measured in 10 subjects at 4T (df) and 7T (gi). LCModel correlation coefficients are presented as a function of a number of transients (a-c). Scatter plots (d,g) PCr vs. Cr (NT = 8); (e,h) NAAG vs. NAA (NT = 128); (f,i) Glu vs. Gln (NT = 8) document that strong negative correlations between these pairs of metabolites were not observed. Number of subjects and number of spectra per subject are the same as in Fig. 6.

References

    1. Gruetter R, Weisdorf SA, Rajanayagan V, Terpstra M, Merkle H, Truwit CL, Garwood M, Nyberg SL, Ugurbil K. Resolution improvements in in vivo 1H NMR spectra with increased magnetic field strength. J Magn Reson. 1998;135:260–264. - PubMed
    1. Pfeuffer J, Tkáč I, Provencher SW, Gruetter R. Toward an in vivo neurochemical profile: quantification of 18 metabolites in short-echo-time 1H NMR spectra of the rat brain. J Magn Reson. 1999;141:104–120. - PubMed
    1. Barker PB, Hearshen DO, Boska MD. Single-voxel proton MRS of the human brain at 1.5T and 3.0T. Magn Reson Med. 2001;45:765–769. - PubMed
    1. Bartha R, Drost DJ, Menon RS, Williamson PC. Comparison of the quantification precision of human short echo time 1H spectroscopy at 1.5 and 4.0 Tesla. Magn Reson Med. 2000;44:185–192. - PubMed
    1. Gonen O, Gruber S, Li BS, Mlynarik V, Moser E. Multivoxel 3D proton spectroscopy in the brain at 1.5 versus 3.0 T: signal-to-noise ratio and resolution comparison. AJNR Am J Neuroradiol. 2001;22:1727–1731. - PMC - PubMed

Publication types