. 2009 Sep 15;333(2):312-23.
doi: 10.1016/j.ydbio.2009.06.043. Epub 2009 Jul 8.

High-resolution gene expression analysis of the developing mouse kidney defines novel cellular compartments within the nephron progenitor population

Affiliations

High-resolution gene expression analysis of the developing mouse kidney defines novel cellular compartments within the nephron progenitor population

Joshua W Mugford et al. Dev Biol. .

Abstract

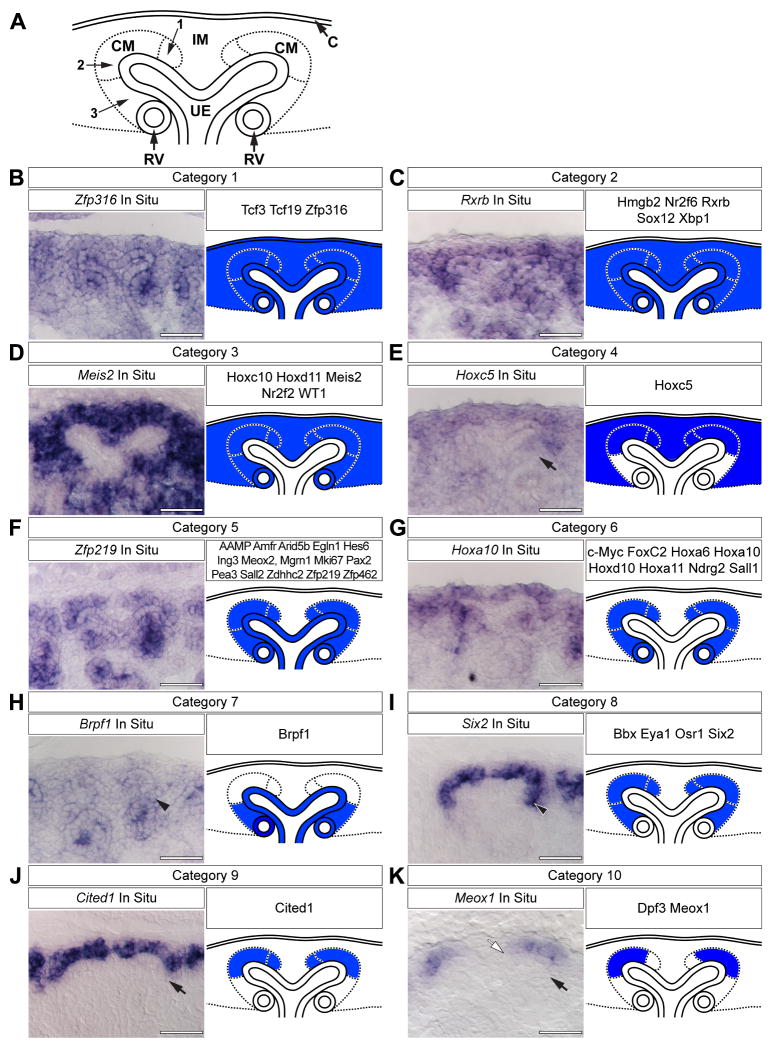
The functional unit of the kidney is the nephron. During its organogenesis, the mammalian metanephric kidney generates thousands of nephrons over a protracted period of fetal life. All nephrons are derived from a population of self-renewing multi-potent progenitor cells, termed the cap mesenchyme. However, our understanding of the molecular and cellular mechanisms underlying nephron development is at an early stage. In order to identify factors involved in nephrogenesis, we performed a high-resolution, spatial profiling of a number of transcriptional regulators expressed within the cap mesenchyme and early developing nephron. Our results demonstrate novel, stereotypic, spatially defined cellular sub-domains within the cap mesenchyme, which may, in part, reflect induction of nephron precursors. These results suggest a hitherto unappreciated complexity of cell states that accompany the assembly of the metanephric kidney, likely reflecting diverse regulatory actions such as the maintenance and induction of nephron progenitors.


Figures

Figure 1
Figure 1. Categorized gene expression within the cap mesenchyme
(A) Schematic representation of the nephrogenic zone. Numbers indicate sub-domains within the cap mesenchyme. (B-K) SISH for representative transcriptional regulators and the schematic interpretation and categorization of all expression patterns examined. Black arrows (E, K, J) indicate lack of expression in aggregating mesenchyme. Black arrowheads (H, I) indicate expression in aggregating mesenchyme. White arrow (K) indicates lack of expression in mesenchyme near the cleft of the ureteric epithelium. C = renal capsule, IM = interstitial mesenchyme, CM = cap mesenchyme, RV = renal vesicle and UE = ureteric epithelium. Scale bars = 50 μm.
Figure 2
Figure 2. Combinatorial analysis of expression patterns reveals new domains within the cap mesenchyme
(A-O) Confocal immunofluorescence of E15.5 Osr1GCE/+, (A-E), Wnt4GC/+ (F-J) or wild type (K-O) metanephric kidneys immunostained for Six2 (A, F), Cited1 (B, G), GFP (C, H) Cytokeratin (K), Hoxd11, Foxd1, WT1 (L) and Flk1 (M). Nuclei stained for Hoechst 33258 (E, J, O). Merged images (D, I, N). (P-R) Immunohistochemistry for Pax2 combined with In situ hybridization for Six2 (P), Eya1 (Q) and Meox1 (R). (S) Schematic representation of novel domains within the cap mesenchyme. Dashed lines (A-J, P-R) indicate the ureteric epithelium. Arrowheads and concave arrowheads (A-D) indicate Six2+, Cited1+, GFP+ and Six2+, Cited1-, GFP+ cells, respectively. Arrowheads (F-I) indicate Six2+, Cited1-, GFP+ cells. Arrowheads (K-N) indicate Flk1+ endothelium. Black and white arrowheads (P) indicate Pax2+, Six2 expressing mesenchyme and Pax2+ pretubular aggregate, respectively. Arrowheads and concave arrowheads (Q) indicate Pax2+, Eya1 expressing mesenchyme and Pax2+ mesenchyme, respectively. Arrowheads, white concave arrowheads and black concave arrowheads (R) indicate Pax2+, Meox1 expressing mesenchyme and Pax2+ mesenchyme near the nephric duct cleft and cortical to the renal vesicle, respectively. Scale bars = 50 μm.
Figure 3
Figure 3. Lef1, Pea3 and Wnt4 denote induced cap mesenchyme cells
(A-O) Confocal immunofluorescence of E11.5 Wnt4GC/+ (A-E), Wnt9b+/- (F-J) and Wnt9b-/- (K-O) metanephric kidneys immunostained for Pax2 (A, F, K), Lef1 (B, G, L), GFP (C) and Pea3 (H, M). Nuclei stained for Hoechst 33258 (E, J, O). Merged images (D, I, N). Dashed lines (A-O) indicate the ureteric epithelium. Asterisks (A-D, F-I, K-N) indicate cortical Pax2+ cap mesenchyme. Arrowheads and concave arrowheads (A-D) indicate Lef1+, GFP-, Pax2- and Lef1+, GFP+, Pax2+ cells, respectively. Arrowheads, yellow arrowheads and concave arrowheads (F-J) indicate Lef1+, Pea3-, Pax2+ cells, Lef1+, Pax2+, Pea3+ cells and Lef1-, Pax2+, Pea3+ cells, respectively. Solid boxes (F-J) indicate inset area. Arrowheads and concave arrowheads (K-N) indicate Lef1-, Pea3-, Pax2+ and Lef1-, Pea3+, Pax2+ cells, respectively. Scale bars = 50 μm.
Figure 4
Figure 4. Cited1+ cells do not demonstrate a response to inductive signals
(A-T) Immunofluorescent confocal microscopy of transverse sections of the E10.5 metanephric blastema (A-E), saggital sections of E11.5 (F-J) and E12.5 metanephric kidneys (K-O) and frontal sections of E15.5 wild type (P-T) metanephric kidneys. Samples immunostained for Lef1 (A, F, K, P), Pea3 (B, G, L, Q) and Cited1 (C, H, M, R). Nuclei stained for Hoechst 33258 (E, J, O, T). Merged images (D, I, N, S). Dashed lines (A-S) indicate ureteric epithelium. White arrowheads and concave arrowheads (A-D, F-I, K-N, P-S) indicate Cited1+, Pea3+, Lef1- cap mesenchyme and Cited1-, Pea3+, Lef1+ stromal mesenchyme, respectively. Yellow concave arrowheads (F-I, K-N, P-S) indicate Cited1-, Pea3+, Lef1+ induced cap mesenchyme. Yellow arrowheads (K-N, P-S) indicate Lef1+ cells adjacent to the ureteric epithelium. Scale bars = 50μm.
Figure 5
Figure 5. Global activation of canonical Wnt signaling does not ectopically induce markers of induction within the cap mesenchyme
(A-H) DMSO treated (A-D) or BIO treated (E-H) E11.5 metanephric kidneys of Axin2-LacZ (A, E) or wild-type mice (B-D, F-H). Sections stained for X-gal (A, E), immunostained for Pax2 (green) and Cytokeratin (blue) (B, F) or immunostained for Lef1 (red) and Cytokeratin (blue) (C, G). Merged images (D, H). (I-P) DMSO treated (I-L) or BIO treated (M-P) E15.5 metanephric kidneys of Axin2-LacZ (I, M) or wild-type mice (J-L, M-O). Sections stained for X-gal (I, M), immunostained for Lef1 (green) and Cytokeratin (blue) (J, N) or immunostained for Cited1 (red) and Cytokeratin (blue) (K, O). Merged images (L, P). Dashed lines, asterisks, arrowheads and concave arrowheads (A, E, I, M) indicate X-gal+ ureteric epithelium, cortical interstitium, cap mesenchyme and induced cap mesenchyme, respectively. Arrowheads and concave arrowheads (B-D, F-H, J-L, N-P) indicate Lef1- cap mesenchyme and Lef1+ induced cap mesenchyme, respectively. Arrows (F-H, N-P) indicated elevated Lef1 levels in cortical interstitium after BIO treatment. Scale bars = 50 μm.
Figure 6
Figure 6. Differential gene expression in pretubular aggregates, renal vesicles and developing S-shaped bodies
(A-O) Confocal immunofluorescence of E15.5 Wnt4GC/+ metanephric kidneys immunostained for E-cadherin (A, F), Lef1 (B, G, L), GFP (C, H, M) and Lhx1 (K). Nuclei stained for Hoechst 33258 (E, J, O). Merged images (D, I, N). Dashed lines and asterisks (A-D) indicate E-cadherin+ renal vesicle and E-cadherin- pretubular aggregate, respectively. Dashed lines (K-O) indicate the ureteric epithelium. White arrowheads and concave arrowheads (A-D) indicate Lef1high, GFPlow and Lef1low, GFPhigh cells, respectively. White arrowheads and concave arrowheads (F-I) indicate Lef1+, GFP- and Lef1low, GFP+ cells, respectively. White arrowheads and concave arrowheads (A-D) indicate Lef1low, Lhx1+ and Lef1high, Lhx1+ cells, respectively. Scale bars = 50 μm.

References

    1. Bouchard M, Souabni A, Mandler M, Neubuser A, Busslinger M. Nephric lineage specification by Pax2 and Pax8. Genes Dev. 2002;16:2958–70. - PMC - PubMed
    1. Boyle S, Misfeldt A, Chandler KJ, Deal KK, Southard-Smith EM, Mortlock DP, Baldwin HS, de Caestecker M. Fate mapping using Cited1-CreERT2 mice demonstrates that the cap mesenchyme contains self-renewing progenitor cells and gives rise exclusively to nephronic epithelia. Dev Biol. 2008;313:234–45. - PMC - PubMed
    1. Boyle S, Shioda T, Perantoni AO, de Caestecker M. Cited1 and Cited2 are differentially expressed in the developing kidney but are not required for nephrogenesis. Dev Dyn. 2007;236:2321–30. - PubMed
    1. Bridgewater D, Cox B, Cain J, Lau A, Athaide V, Gill PS, Kuure S, Sainio K, Rosenblum ND. Canonical WNT/beta-catenin signaling is required for ureteric branching. Dev Biol 2008 - PubMed
    1. Brodbeck S, Englert C. Genetic determination of nephrogenesis: the Pax/Eya/Six gene network. Pediatr Nephrol. 2004;19:249–55. - PubMed

Publication types