. 2009 Sep 10;38(2):121-37.
doi: 10.1016/j.ejps.2009.06.009. Epub 2009 Jul 8.

P-glycoprotein deficient mouse in situ blood-brain barrier permeability and its prediction using an in combo PAMPA model

Affiliations

P-glycoprotein deficient mouse in situ blood-brain barrier permeability and its prediction using an in combo PAMPA model

Claude Dagenais et al. Eur J Pharm Sci. .

Abstract

The purpose of the study was to assess the permeability of mouse blood-brain barrier (BBB) to a diverse set of compounds in the absence of P-glycoprotein (Pgp) mediated efflux, to predict it using an in combo PAMPA model, and to explore its role in brain penetration classification (BPC). The initial brain uptake (K(in)) of 19 compounds in both wild-type and Pgp mutant [mdr1a(-/-)] CF-1 mice was determined by the in situ brain perfusion technique. PAMPA measurements were performed, and the values were used to develop an in combo model, including Abraham descriptors. Published rodent K(in) values were used to enhance the dataset and validate the model. The model predicted 92% of the variance of the training set permeability. In all, 182 K(in) values were considered in this study, spanning four log orders of magnitude and where Pgp decreased brain uptake by as much as 14-fold. The calculated permeability-surface area (PS) values along with literature reported brain tissue binding were used to group molecules in terms of their brain penetration classification. The in situ BBB permeability can be predicted by the in combo PAMPA model to a satisfactory degree, and can be used as a lower-cost, high throughput first-pass screening method for BBB passive permeability.


Figures

Fig. 1
Fig. 1
The log permeability vs. pH plots of twelve of the 42 molecules measured by the PAMPA method. The pH was varied to assess the contribution of the aqueous boundary layer. The best-fits of eq. 1 to the measured effective permeability data are represented by the solid curves, and the ABL-corrected log Pm - pH curves are represented by dashed curves. The dotted lines correspond to the log PABL values, derived from the refinement model based on eq. 1. The maximum point in the log Pm curves corresponds to the intrinsic permeability coefficient, log Po, which characterizes the transport of the neutral form of an ionizable molecule. The intersections of the horizontal and the diagonal tangents occur at pH values corresponding to the pKa in the dashed curves and pKaflux in the solid curves.
Fig. 2
Fig. 2
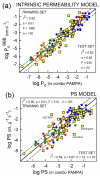
Prediction of the Pgp deficient mouse brain perfusion log PS values of the 130 measurements training set (filled circles; Table 3) and the 52 compound test set (yellow squares; Table 4: data of Summerfield et al. 2007, Gratton et al. 1997, and Obradovic et al. 2007) with the in combo PAMPA model (Table 5). In the training set, red symbols correspond to acids (negative charged at pH 7.4), blue symbols to bases (positively charged at pH 7.4), orange to zwitterions and green to uncharged drugs. The upper frame (a) is the prediction based on the intrinsic permeability values, and the lower frame (b) has the predicted values converted back to the PS scale.
Fig. 3
Fig. 3
Rank order comparison of in combo PAMPA predicted PS values and various measured in vivo PS values. The vertical axis cut-off values are 20 and 150; the horizontal axis cut-offs are 20 and 70.
Fig. 4
Fig. 4
Comparison of active vs. passive permeability. For the down-pointing (blue) triangle symbols, the vertical axis represents the measured PS values (WT), whereas the horizontal scale represents the PSpassive values calculated by the in combo PAMPA model. The dashed diagonal lines represent a three-fold difference, where compounds falling below the threshold line show a significant Pgp effect. Compounds that may be uptaken by some carrier-mediated (CM) process in in situ brain perfusion measurements are indicated as upward displacements by upward-pointing (red) triangles. For the CM set, the calculated PSpassive underestimates the observed permeability values.
Fig. 5
Fig. 5
The BPC scheme of Kalvass et al. 2007 with two additional parameters, PSpassive (this study) and t1/2,eq (Liu et al. 2005), superposed on the compound symbols: (a) the size of the symbols is proportional to log PSpassive; (b) the values of log t1/2,eq are proportionally represented by the dimensions of the “cross” symbol.

References

    1. Abbott NJ. In vitro models for examining and predicting brain uptake of drugs. In: Testa B, van de Waterbeemd H, editors. Comprehensive Medicinal Chemistry II, Vol. 5: ADME-Tox Approaches. Elsevier; Amsterdam: 2007. pp. 301–320.
    1. Abraham MH, Takács-Novák K, Mitchell RC. On the partition of ampholytes: application to blood-brain distribution. J. Pharm. Sci. 1997;86:310–315. - PubMed
    1. Abraham MH. The factors that influence permeation across the blood-brain barrier. Eur. J. Med. Chem. 2004;39:235–240. - PubMed
    1. Aoyagi M, Agranoff BW, Washburn LC, Smith QR. Blood-brain barrier transport of 1-aminocyclohexanecarboxylic acid, a nonmetabolic amino acid for in vivo studies of brain transport. J. Neurochem. 1988;50:1220–1226. - PubMed
    1. Avdeef A. Absorption and Drug Development. Wiley-Interscience; 2003. pp. 116–246.

Publication types

Substances