. 2009 Jul 17;31(1):99-109.
doi: 10.1016/j.immuni.2009.05.009.

Integrin-dependent organization and bidirectional vesicular traffic at cytotoxic immune synapses

Affiliations

Integrin-dependent organization and bidirectional vesicular traffic at cytotoxic immune synapses

Dongfang Liu et al. Immunity. .

Abstract

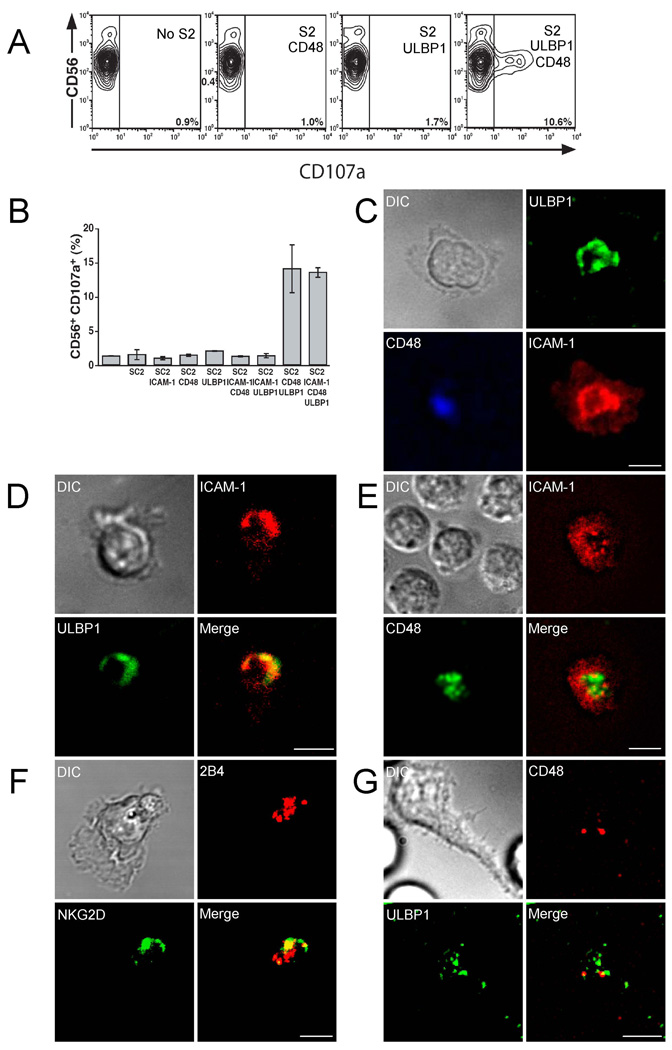
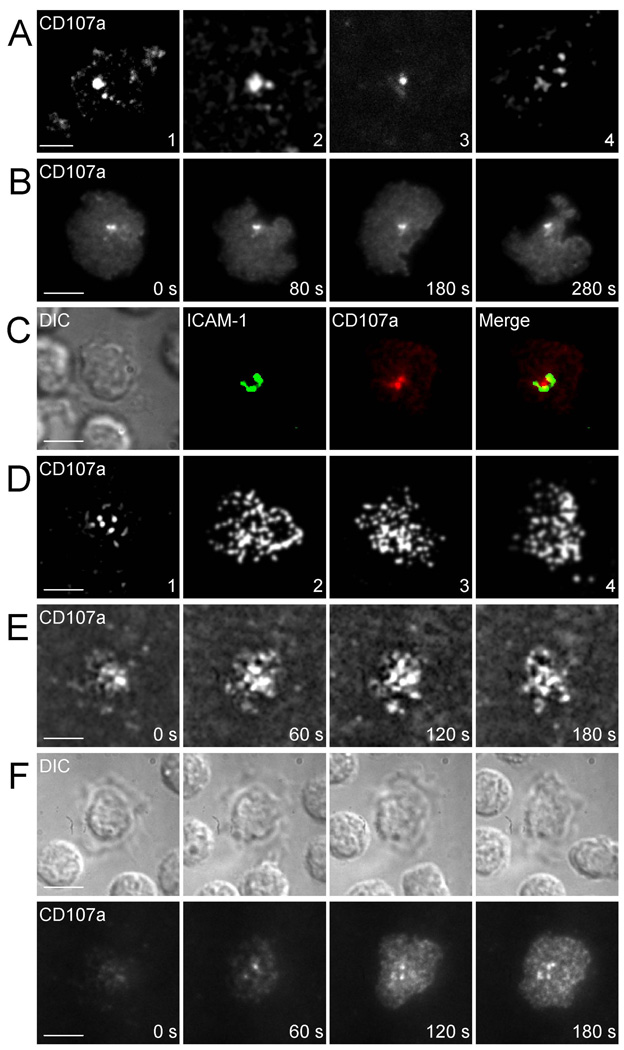
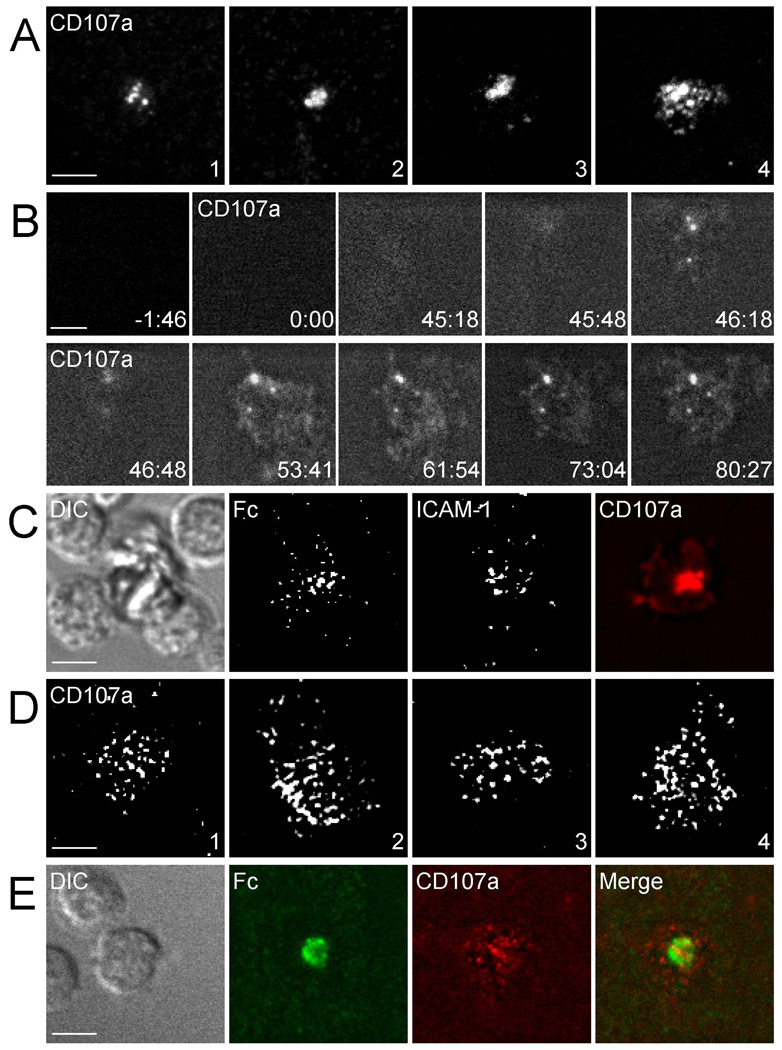
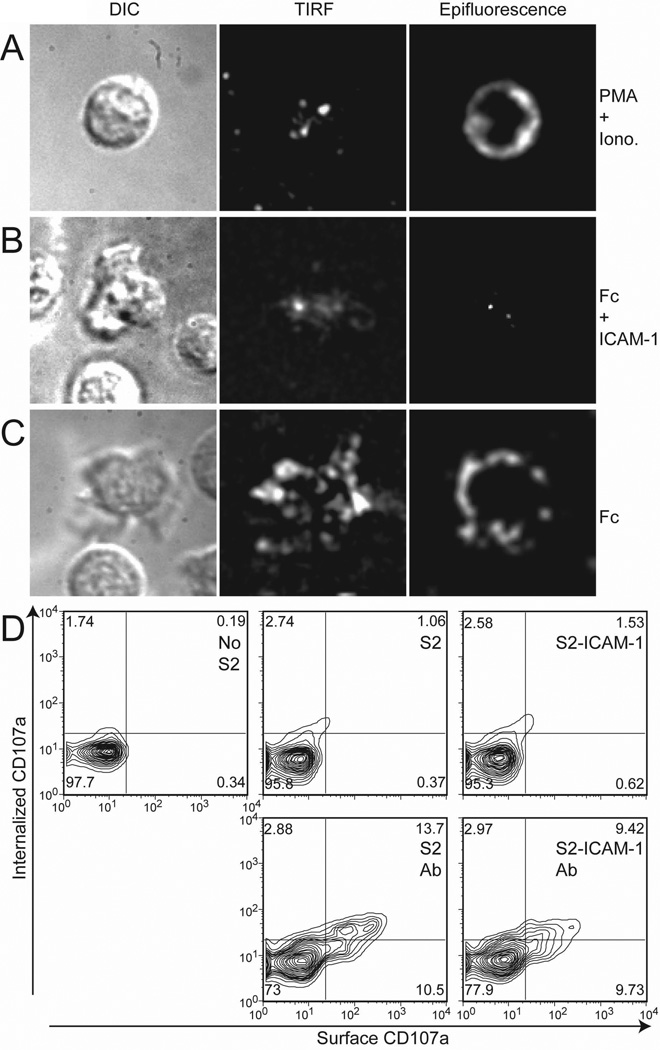
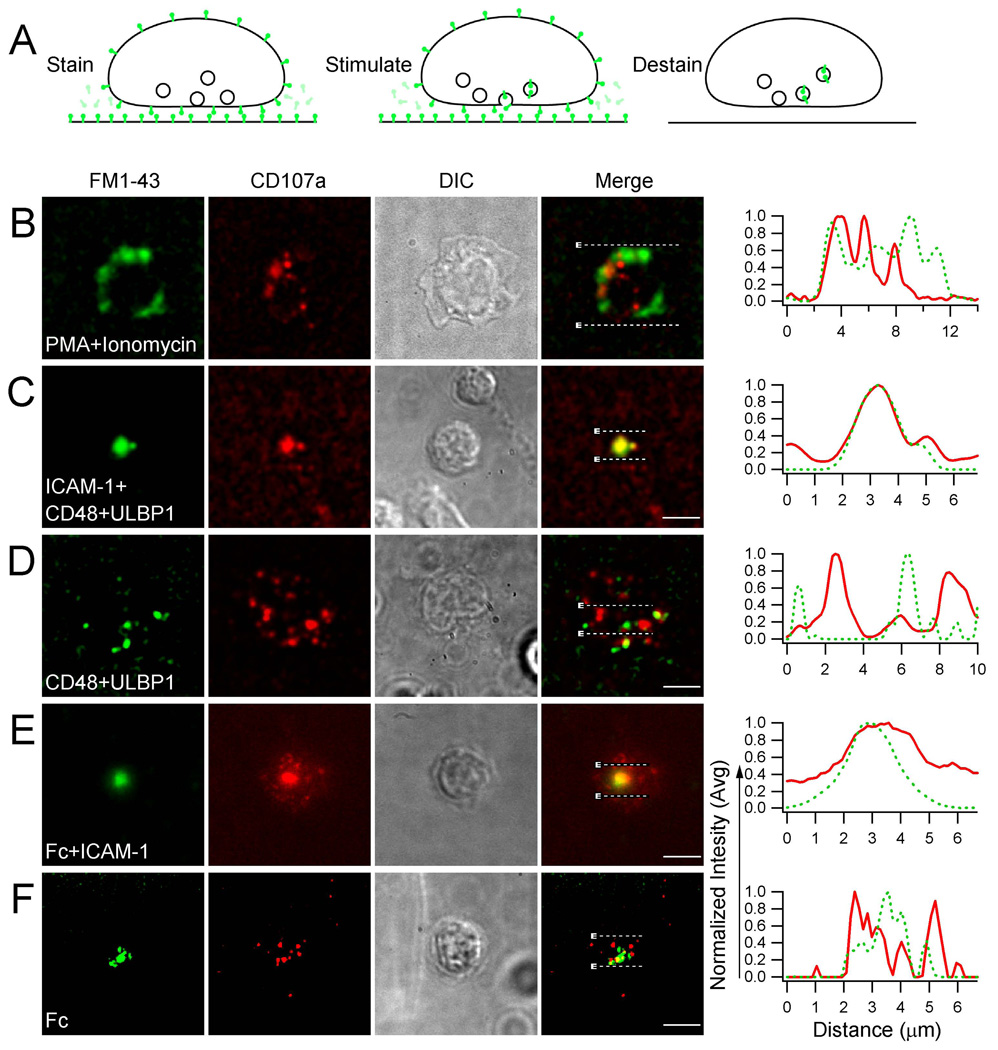
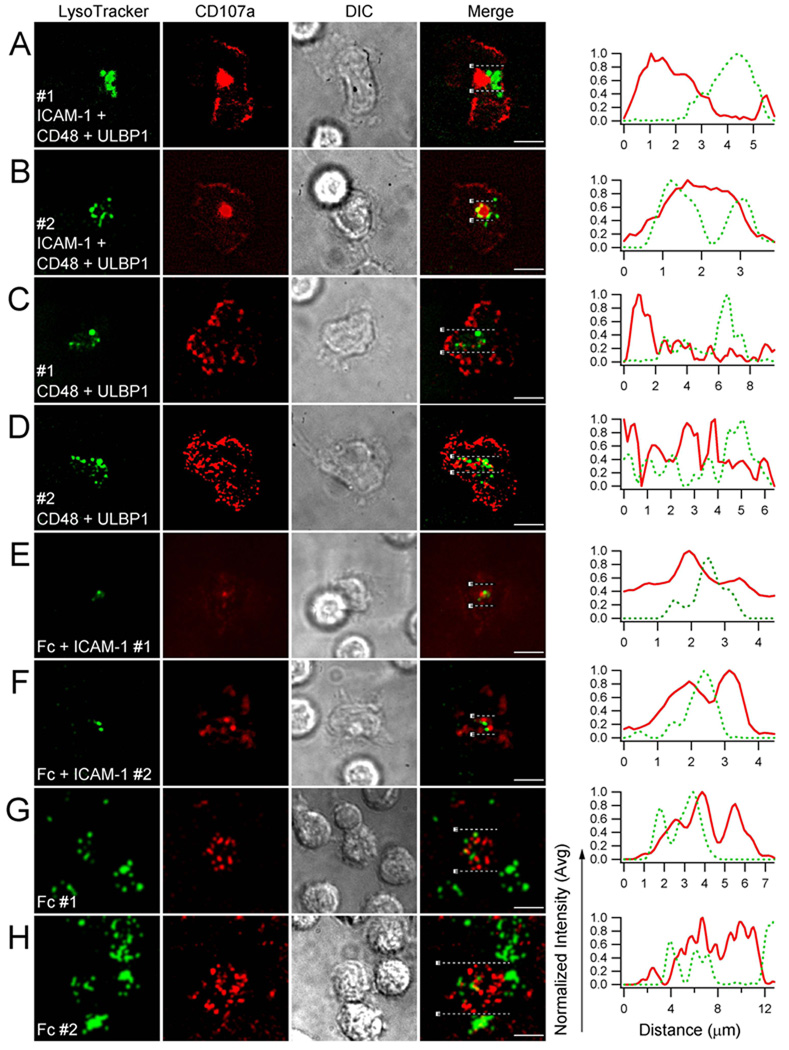
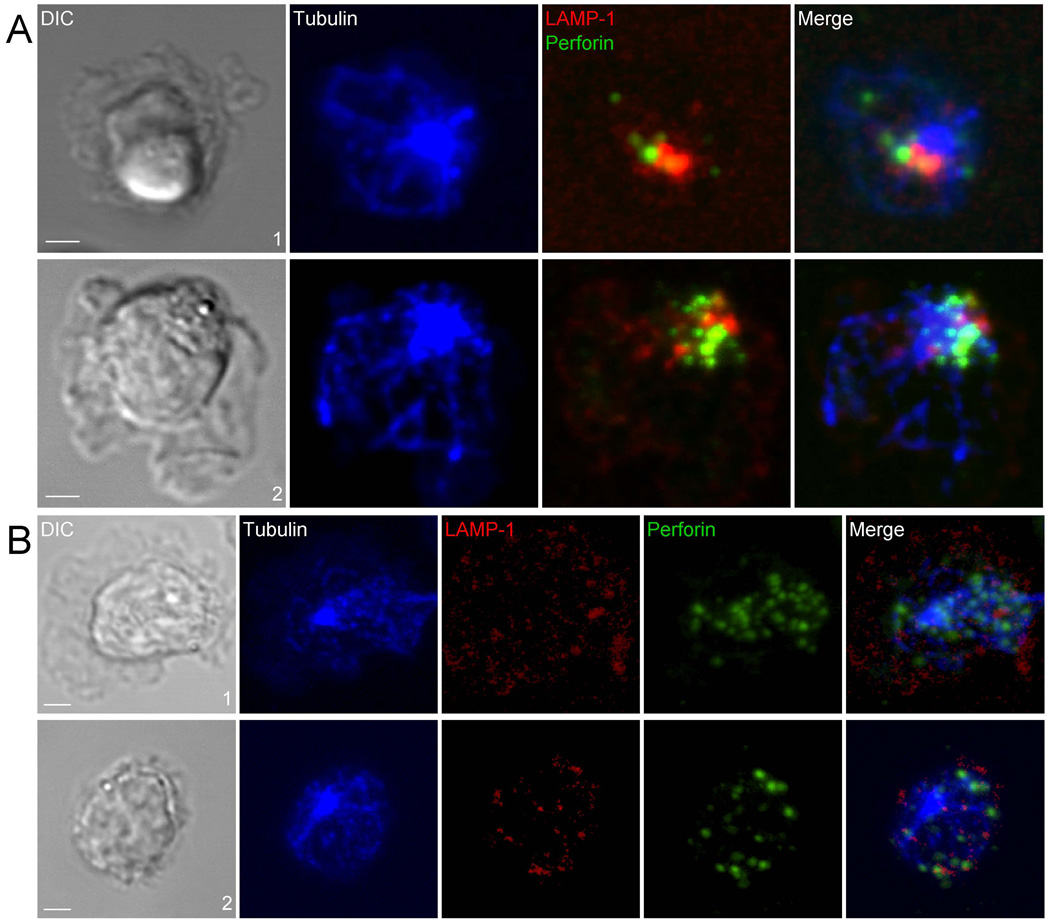
Cytotoxic lymphocytes kill target cells by releasing the content of secretory lysosomes at the immune synapse. To understand the dynamics and control of cytotoxic immune synapses, we imaged human primary, live natural killer cells on lipid bilayers carrying ligands of activation receptors. Formation of an organized synapse was dependent on the presence of the beta2 integrin ligand ICAM-1. Ligands of coactivation receptors 2B4 and NKG2D segregated into central and peripheral regions, respectively. Lysosomal protein LAMP-1 that was exocytosed during degranulation accumulated in a large and spatially stable cluster, which overlapped with a site of membrane internalization. Lysosomal compartments reached the plasma membrane at focal points adjacent to centrally accumulated LAMP-1. Imaging of fixed cells revealed that perforin-containing granules were juxtaposed to an intracellular compartment where exocytosed LAMP-1 was retrieved. Thus, cytotoxic immune synapses include a central region of bidirectional vesicular traffic, which is controlled by integrin signaling.


Figures

Figure 1
Figure 1. ICAM-1 Controls the Organization of Natural Cytotoxicity Immune Synapses
Scale bars are 5.0 µm. The images are representative of at least 20 cells in three independent experiments. (A) CD107a staining of resting NK cells after mixing with S2 insect cells transfected with the indicated ligands. A control without S2 cells is also shown. (B) Percentage of CD107a+ NK cells after mixing with the indicated transfected S2 cells. Bars indicate SD of triplicate samples. (C) TIRF image of an NK cell fixed ~60 min after addition to a bilayer carrying ICAM-1-Alexa Fluor 568, ULBP1-Alexa Fluor 488, and CD48-Alexa Fluor 647. (D) TIRF image of a live NK cell at ~60 min after addition to a bilayer carrying ICAM-1-Alexa Fluor 568, ULBP1-Alexa Fluor 488, and unlabeled CD48. (E) TIRF image of live NKs cell at ~130 min after addition to a bilayer carrying ICAM-1-Alexa Fluor 568, CD48-Alexa Fluor 488, and unlabeled ULBP1. (F) Confocal image of an NK cell fixed ~60 min after addition to a bilayer carrying unlabeled CD48 and ULBP1. Fixed and permeabilized cells were incubated with Abs to 2B4 and NKG2D, followed by Alexa Fluor 568 and Alexa Fluor 488 conjugated secondary Abs, respectively. (G) TIRF image of live NK cells at ~90 min after addition to a bilayer carrying CD48-Alexa Fluor 568 and ULBP1-Alexa Fluor 488.
Figure 2
Figure 2. LAMP-1 Accumulates in a Central Cluster within Cytotoxic Immune Synapses
Degranulation was monitored by TIRFM with a soluble CD107a F(ab) conjugated with Alexa Fluor 647. Scale bars are 5.0 µm. The images are representative of at least 30 cells in five independent experiments. (A to C) Live NK cells imaged on bilayers carrying ICAM-1, CD48, and ULBP1. (A) Individual cells imaged at ~100 min (#1), ~120 min (#2), ~180 min (#3), and ~60 min (#4), after addition to the bilayer. (B) Time-lapsed images taken at ~120 min after addition of NK cells to the bilayer. (C) NK cells imaged at ~120 min after addition to a bilayer carrying unlabeled CD48 and ULBP1 and Alexa Fluor 488 conjugated ICAM-1. (D to F) Live NK cells imaged on bilayers carrying unlabeled CD48 and ULBP1. (D) Individual cells imaged at ~90 min (#1), ~120 min (#2), ~120 min (#3), and ~180 min (#4) after addition to the bilayer. (E) Time-lapsed images taken at ~120 min after addition of NK cells to the bilayer. (F) NK cells imaged ~200 min after addition to the lipid bilayer. Time-lapsed DIC (top panel) and TIRF (bottom panel) images.
Figure 3
Figure 3. Central Accumulation of LAMP-1 in Synapses Formed over Ligands for LFA-1 and CD16
Degranulation was monitored by TIRFM with a soluble CD107a F(ab) conjugated with Alexa Fluor 647. Scale bars are 5.0 µm. The images are representative of at least 50 cells in five independent experiments. (A and B) Live NK cells imaged on bilayers carrying unlabeled ICAM-1 and IgG1 Fc. (A) Individual cells imaged at ~50 min (#1), ~80 min (#2), ~120 min (#3), and ~26 min (#4), after addition to the bilayer. (B) Time series taken from Movie S8. The first frame was taken prior to the addition of CD107a Fab and of NK cells. The second frame was taken at the time of CD107a Fab and NK cell injection into the chamber. (C) NK cells imaged at ~120 min after addition to a bilayer carrying Alexa Fluro 488 conjugated ICAM-1 and Alexa Fluor 568 conjugated Fc. (D and E) Live NK cells imaged on bilayers carrying IgG1 Fc alone. (D) Individual cells imaged at ~30 min (#1), ~40 min (#2), ~60 min (#3), and ~100 min (#4) after addition to the bilayer. (E) NK cells imaged at ~30 min after addition to a bilayer carrying Alexa Fluor 488-conjugated Fc.
Figure 4
Figure 4. Diffusion of LAMP-1 on Degranulating Cells Is Constrained in the Presence of ICAM-1
(A to C) Live NK cells over lipid bilayers were imaged by DIC, TIRF, and epifluorescence, after incubation with a soluble CD107a F(ab) conjugated with Alexa Fluor 647. The DIC, TIRF, and epifluorescence images were acquired within one second of each other. Scale bars are 5.0 µm. The images are representative of 10 cells in three independent experiments. (A) NK cell on a bilayer carrying unlabeled ICAM-1 imaged 20 min after addition of PMA and ionomycin. (B) NK cells imaged ~140 min after addition to a bilayer carrying unlabeled ICAM-1 and Fc. (C) NK cells imaged ~37 min after addition to a bilayer carrying unlabeled Fc alone. (D) Staining of extracellular and internalized LAMP-1 with CD107a Ab 2 hours after mixing NK cells with S2 cells, S2 cells transfected with ICAM-1, and S2 cells coated with rabbit antiserum (Ab), as indicated. NK cells were gated by staining with FITC-conjugated CD56 mAb. Selective staining of internalized LAMP-1 by PE and of cell surface LAMP-1 by allophycocyanin using biotinylated CD107a Ab is described in Experimental Procedures.
Figure 5
Figure 5. Internalized Membranes Co-Localize with Centrally Accumulated LAMP-1
(A) Internalized membranes in FM1-43-labeled and stimulated NK cells were detected by TIRFM after destaining with ADVASEP-7. FM1-43 has almost no fluorescent properties in aqueous solution. NK cells were incubated with 8.0 µM FM1-43 at 37ºC for 5 min and injected into Bioptechs chamber for 60 min. For destaining, FM1-43 was stripped for 2 min with 1.0 mM ADVASEP-7. (B to F) Degranulation was monitored by TIRFM with a soluble CD107a F(ab) conjugated with Alexa Fluor 647. The DIC, FM1-43, and LAMP-1 images were acquired within one second of each other. The normalized intensity of CD107a (Red lines) and FM1-43 (Green lines) signals within the parallel horizons indicated in the composites were graphed in the right panels. Scale bars are 5.0 µm. The images are representative of at least 20 cells in three independent experiments. (B) PMA and ionomycin-stimulated NK cells imaged ~20 min after addition to a bilayer carrying unlabeled ICAM-1. (C) NK cells imaged ~160 min after addition to a bilayer carrying unlabeled CD48, ULBP1, and ICAM-1. (D) NK cells imaged ~200 min after addition to a bilayer carrying unlabeled CD48 and ULBP1. (E) NK cells imaged ~120 min after addition to a bilayer carrying unlabeled Fc and ICAM-1. (F) NK cells imaged ~60 min after addition to a bilayer carrying unlabeled Fc.
Figure 6
Figure 6. Lysosomal Compartments Reach the Plasma Membrane at Focal Points Adjacent to Accumulated LAMP-1
Scale bars are 5.0 µm. The images are representative of at least 50 cells in three independent experiments. Lysosomal compartments labeled with LysoTracker Green and exocytosed LAMP-1 labeled with a soluble CD107a Fab conjugated with Alexa Fluor 647 were imaged by TIRFM. DIC and TIRF images were acquired within one second of each other. The normalized intensity of CD107a (Red lines) and LysoTracker (Green lines) over the parallel horizon indicated in the merged images are shown in the panels on the right. (A and B) NK cells imaged on bilayers carrying unlabeled CD48, ULBP1, and ICAM-1 ~90 min (#1) and ~170 min (#2) after injection over the bilayer. (C and D) NK cells imaged on bilayers carrying unlabeled CD48 and ULBP1 ~88 min (#1) and ~260 min (#2) after injection over the bilayer. (E and F) NK cells imaged on bilayers carrying unlabeled Fc and ICAM-1 ~130 min (#1) and ~50 min (#2) after injection over the bilayer. (G and H) NK cells imaged on bilayers carrying unlabeled Fc ~60 min (#1) and ~130 min (#2) after injection over the bilayer.
Figure 7
Figure 7. Polarized Perforin-Containing Lytic Granules Contact Internalized LAMP-1 in the Presence of ICAM-1
(A) NK cells imaged on bilayers containing Fc and ICAM-1 ~60 min (#1) and ~120 min (#2) after injection over the bilayer. Perforin (Green), internalized LAMP-1 (Red), and Tubulin (Blue) were acquired by 3D confocal microscopy. Scale bars are 5.0 µm. The images are representative of at least 30 cells in two independent experiments. (B) NK cells imaged on bilayers carrying Fc ~120 min after injection over bilayer. Differential interference contrast (DIC) images are shown on the Left. Merged overlays of fluorescent are on the Right. LAMP-1(Red) detected by inclusion of 0.016 µM Alexa Fluor 647-labeled CD107a Fab during NK cell incubation on with lipid bilayer containing Fc, MTOC (Blue) and perforin (Red) are shown in Center. Scale bars are 2.0 µm. The images are representative of 50 cells in three independent experiments.

References

    1. Anikeeva N, Somersalo K, Sims TN, Thomas VK, Dustin ML, Sykulev Y. Distinct role of lymphocyte function-associated antigen-1 in mediating effective cytolytic activity by cytotoxic T lymphocytes. Proc Natl Acad Sci U S A. 2005;102:6437–6442. - PMC - PubMed
    1. Barber DF, Faure M, Long EO. LFA-1 contributes an early signal for NK cell cytotoxicity. J Immunol. 2004;173:3653–3659. - PubMed
    1. Beal AM, Anikeeva N, Varma R, Cameron TO, Norris PJ, Dustin ML, Sykulev Y. Protein kinase Ctheta regulates stability of the peripheral adhesion ring junction and contributes to the sensitivity of target cell lysis by CTL. J Immunol. 2008;181:4815–4824. - PMC - PubMed
    1. Bryceson YT, March ME, Barber DF, Ljunggren HG, Long EO. Cytolytic granule polarization and degranulation controlled by different receptors in resting NK cells. J Exp Med. 2005;202:1001–1012. - PMC - PubMed
    1. Bryceson YT, March ME, Ljunggren HG, Long EO. Activation, coactivation, and costimulation of resting human natural killer cells. Immunol Rev. 2006a;214:73–91. - PMC - PubMed

Publication types

MeSH terms