. 2009 Sep 15;25(18):2369-75.
doi: 10.1093/bioinformatics/btp425. Epub 2009 Jul 9.

TileProbe: modeling tiling array probe effects using publicly available data

Affiliations

TileProbe: modeling tiling array probe effects using publicly available data

Jennifer Toolan Judy et al. Bioinformatics. .

Abstract

Motivation: Individual probes on an Affymetrix tiling array usually behave differently. Modeling and removing these probe effects are critical for detecting signals from the array data. Current data processing techniques either require control samples or use probe sequences to model probe-specific variability, such as with MAT. Although the MAT approach can be applied without control samples, residual probe effects continue to distort the true biological signals.

Results: We propose TileProbe, a new technique that builds upon the MAT algorithm by incorporating publicly available data sets to remove tiling array probe effects. By using a large number of these readily available arrays, TileProbe robustly models the residual probe effects that MAT model cannot explain. When applied to analyzing ChIP-chip data, TileProbe performs consistently better than MAT across a variety of analytical conditions. This shows that TileProbe resolves the issue of probe-specific effects more completely.

Availability: http://www.biostat.jhsph.edu/ approximately hji/cisgenome/index_files/tileprobe.htm.


Figures

Fig. 1.
Fig. 1.
Illustration of probe effects on Affymetrix Mouse Promoter 1.0R arrays. (a) IP1–IP3, CT1–CT3: quantile normalized Gli3 ChIP and control probe intensities at log2 scale. Log2(FC): log2(IP/CT) fold change. IP1_MAT-IP3_MAT: MAT background corrected probe intensities for IP1–IP3. (b) MAT corrected probe intensities for samples collected from different studies. (c) IP_MAT, CT_MAT: MAT corrected probe intensities. MedianMAT_All-GEO-Arrays: median MAT corrected probe intensities across all samples stored in GEO. IP_TileProbe, CT_TileProbe: TileProbe background corrected probe intensities.
Fig. 2.
Fig. 2.
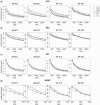
Consistency test. TileProbe (TPV), two variants of TileProbe (TPM and TPQ), MAT and HMMTiling (HT) are compared. For 1IP 1CT, results based on quantile normalization (QN) are also shown. The fraction of predictions that are gold standard is shown for top 200, 400, 600,…, etc. peaks. The gold standard was constructed using MAT 3IP 3CT analysis. To avoid bias caused by peak length, all peaks were forced to be 500 bp long around the peak maxima.
Fig. 3.
Fig. 3.
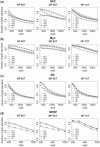
Motif enrichment test. The enrichment ratios of the relevant transcription factor binding motif among the top 200, 400, 600,…, etc. peaks were shown for TileProbe-TPV (TPV), TileProbe-TPM (TPM), TileProbe-TPQ (TPQ), MAT, and HMMTiling (HT). For 1IP 1CT and 3IP 3CT (or 2IP 2CT for NRSF), the enrichment ratio was also shown for quantile normalization (QN). To avoid bias caused by peak length, all peaks were forced to be 500 bp long around the peak maxima.
Fig. 4.
Fig. 4.
Motif enrichment after reducing the number of samples used for building probe model. The enrichment ratios of the relevant transcription factor binding motif among the top 200, 400,…, etc. peaks were shown for TileProbe-TPV and MAT. (a) Gli3, Affymetrix Mouse Promoter 1.0R Array; TPV-6: TileProbe probe model trained using six independent studies (75 samples); TPV-5: five independent studies (38 samples); TPV-3: three studies (19 samples); TPV-1: one study (six samples). (b) Estrogen receptor, Affymetrix Human Tiling 2.0R Array 6; TPV-6: model trained using six independent studies (126 samples); TPV-4: four studies (48 samples); TPV-3: three studies (19 samples); TPV-1: one study (six samples). Only 1IP 0CT analyses are shown. Results for 1IP 1CT, 3IP 0CT and 3IP 3CT can be found in Figure S4.

References

    1. Barrett T, et al. NCBI GEO: Mining tens of millions of ex-pression profiles—database and tools update. Nucleic Acids Res. 2007;35:D760–D765. - PMC - PubMed
    1. Bernstein BE, et al. A bivalent chromatin structure marks key developmental genes in embryonic stem cells. Cell. 2006;125:315–326. - PubMed
    1. Bertone P, et al. Global identification of human transcribed sequences with genome tiling arrays. Science. 2004;306:2242–2246. - PubMed
    1. Bolstad BM, et al. A comparison of normalization methods for high density oligonucleotide array data based on variance and bias. Bioinformatics. 2003;19:185–193. - PubMed
    1. Carroll JS, et al. Chromosome-wide mapping of estrogen receptor binding reveals long-range regulation requiring the forkhead protein FoxA1. Cell. 2005;122:33–43. - PubMed

Publication types

MeSH terms