

NDRG4 is required for cell cycle progression and survival in glioblastoma cells
- PMID: 19592488
- PMCID: PMC2757219
- DOI: 10.1074/jbc.M109.012484
NDRG4 is required for cell cycle progression and survival in glioblastoma cells
Abstract
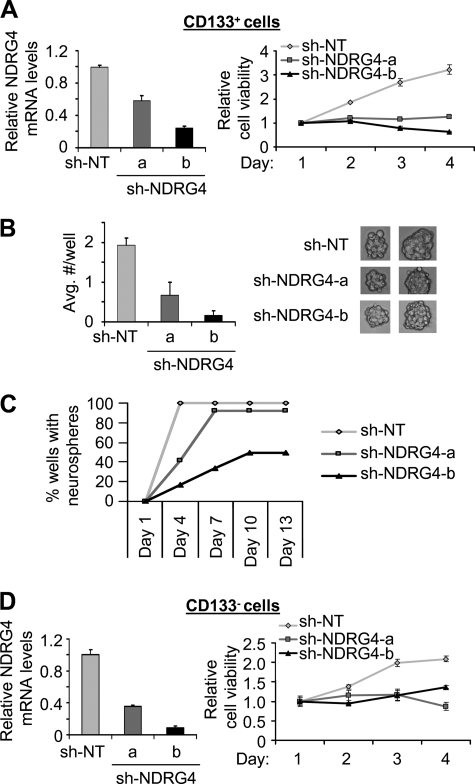
NDRG4 is a largely unstudied member of the predominantly tumor suppressive N-Myc downstream-regulated gene (NDRG) family. Unlike its family members NDRG1-3, which are ubiquitously expressed, NDRG4 is expressed almost exclusively in the heart and brain. Given this tissue-specific expression pattern and the established tumor suppressive roles of the NDRG family in regulating cellular proliferation, we investigated the cellular and biochemical functions of NDRG4 in the context of astrocytes and glioblastoma multiforme (GBM) cells. We show that, in contrast to NDRG2, NDRG4 expression is elevated in GBM and NDRG4 is required for the viability of primary astrocytes, established GBM cell lines, and both CD133(+) (cancer stem cell (CSC)-enriched) and CD133(-) primary GBM xenograft cells. While NDRG4 overexpression has no effect on cell viability, NDRG4 knockdown causes G(1) cell cycle arrest followed by apoptosis. The initial G(1) arrest is associated with a decrease in cyclin D1 expression and an increase in p27(Kip1) expression, and the subsequent apoptosis is associated with a decrease in the expression of XIAP and survivin. As a result of these effects on cell cycle progression and survival, NDRG4 knockdown decreases the tumorigenic capacity of established GBM cell lines and GBM CSC-enriched cells that have been implanted intracranially into immunocompromised mice. Collectively, these data indicate that NDRG4 is required for cell cycle progression and survival, thereby diverging in function from its tumor suppressive family member NDRG2 in astrocytes and GBM cells.
Figures


Similar articles
-
NDRG4 is downregulated in glioblastoma and inhibits cell proliferation.OMICS. 2012 May;16(5):263-7. doi: 10.1089/omi.2011.0146. Epub 2012 Apr 10. OMICS. 2012. PMID: 22489821 Free PMC article.
-
NDRG2 and NDRG4 Expression Is Altered in Glioblastoma and Influences Survival in Patients with MGMT-methylated Tumors.Anticancer Res. 2016 Mar;36(3):887-97. Anticancer Res. 2016. PMID: 26976975
-
MiR-483-5p and miR-139-5p promote aggressiveness by targeting N-myc downstream-regulated gene family members in adrenocortical cancer.Int J Cancer. 2018 Aug 15;143(4):944-957. doi: 10.1002/ijc.31363. Epub 2018 Mar 30. Int J Cancer. 2018. PMID: 29516499
-
Nervous NDRGs: the N-myc downstream-regulated gene family in the central and peripheral nervous system.Neurogenetics. 2019 Oct;20(4):173-186. doi: 10.1007/s10048-019-00587-0. Epub 2019 Sep 4. Neurogenetics. 2019. PMID: 31485792 Free PMC article. Review.
-
CD133 as a marker for regulation and potential for targeted therapies in glioblastoma multiforme.Neurosurg Clin N Am. 2012 Jul;23(3):391-405. doi: 10.1016/j.nec.2012.04.011. Epub 2012 Jun 5. Neurosurg Clin N Am. 2012. PMID: 22748652 Review.
Cited by
-
NDRG3 overexpression is associated with a poor prognosis in patients with hepatocellular carcinoma.Biosci Rep. 2018 Dec 7;38(6):BSR20180907. doi: 10.1042/BSR20180907. Print 2018 Dec 21. Biosci Rep. 2018. PMID: 30413609 Free PMC article.
-
NDRG4 is downregulated in glioblastoma and inhibits cell proliferation.OMICS. 2012 May;16(5):263-7. doi: 10.1089/omi.2011.0146. Epub 2012 Apr 10. OMICS. 2012. PMID: 22489821 Free PMC article.
-
NDRG4 stratifies the prognostic value of body mass index in colorectal cancer.Oncotarget. 2016 Jan 12;7(2):1311-22. doi: 10.18632/oncotarget.6182. Oncotarget. 2016. PMID: 26515606 Free PMC article.
-
NDRG4 hypermethylation is a potential biomarker for diagnosis and prognosis of gastric cancer in Chinese population.Oncotarget. 2017 Jan 31;8(5):8105-8119. doi: 10.18632/oncotarget.14099. Oncotarget. 2017. PMID: 28042954 Free PMC article.
-
A Transcriptomic Signature of Mouse Liver Progenitor Cells.Stem Cells Int. 2016;2016:5702873. doi: 10.1155/2016/5702873. Epub 2016 Oct 3. Stem Cells Int. 2016. PMID: 27777588 Free PMC article.
References
-
- Kyuno J., Fukui A., Michiue T., Asashima M. (2003) Biochem. Biophys. Res. Commun. 309, 52–57 - PubMed
-
- Nakada N., Hongo S., Ohki T., Maeda A., Takeda M. (2002) Brain Res. Dev. Brain Res. 135, 45–53 - PubMed
-
- Nishimoto S., Tawara J., Toyoda H., Kitamura K., Komurasaki T. (2003) Eur. J. Biochem. 270, 2521–2531 - PubMed
-
- Okuda T., Kondoh H. (1999) Biochem. Biophys. Res. Commun. 266, 208–215 - PubMed
Publication types
MeSH terms
Substances
Grants and funding
LinkOut - more resources
Full Text Sources
Medical
Molecular Biology Databases
Research Materials
Miscellaneous
