. 2009 Oct;191(19):6145-56.
doi: 10.1128/JB.00460-09. Epub 2009 Jul 10.

Hopanoids play a role in membrane integrity and pH homeostasis in Rhodopseudomonas palustris TIE-1

Affiliations

Hopanoids play a role in membrane integrity and pH homeostasis in Rhodopseudomonas palustris TIE-1

Paula V Welander et al. J Bacteriol. 2009 Oct.

Abstract

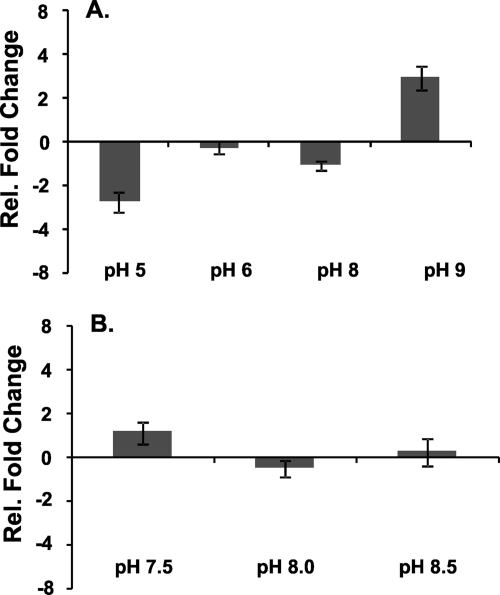
Sedimentary hopanes are pentacyclic triterpenoids that serve as biomarker proxies for bacteria and certain bacterial metabolisms, such as oxygenic photosynthesis and aerobic methanotrophy. Their parent molecules, the bacteriohopanepolyols (BHPs), have been hypothesized to be the bacterial equivalent of sterols. However, the actual function of BHPs in bacterial cells is poorly understood. Here, we report the physiological study of a mutant in Rhodopseudomonas palustris TIE-1 that is unable to produce any hopanoids. The deletion of the gene encoding the squalene-hopene cyclase protein (Shc), which cyclizes squalene to the basic hopene structure, resulted in a strain that no longer produced any polycyclic triterpenoids. This strain was able to grow chemoheterotrophically, photoheterotrophically, and photoautotrophically, demonstrating that hopanoids are not required for growth under normal conditions. A severe growth defect, as well as significant morphological damage, was observed when cells were grown under acidic and alkaline conditions. Although minimal changes in shc transcript expression were observed under certain conditions of pH shock, the total amount of hopanoid production was unaffected; however, the abundance of methylated hopanoids significantly increased. This suggests that hopanoids may play an indirect role in pH homeostasis, with certain hopanoid derivatives being of particular importance.


Figures

FIG. 1.
FIG. 1.
Biosynthesis of hopanoids in R. palustris TIE-1. (A) Hopanoids produced by R. palustris TIE-1. For 32,33,34,35-bacteriohopanetetrol, R2 is OH; for 35-amino-32,33,34-bacteriohopanetriol, R2 is NH2. (B) Structures of the sterol biosynthesis intermediate lanosterol and of cholesterol, demonstrating the structural similarity to hopanoids. (C) Conversion of squalene to the basic hopene structure by the squalene-hopene cyclase. The Entrez Gene accession number for the squalene-hopene cyclase gene is NC_011004.1.
FIG. 2.
FIG. 2.
GC-MS chromatograms of total lipid extracts from TIE-1 strains. (A) R. palustris TIE-1. (B) R. palustris Δshc. (C) R. palustris Δshc plus pPVW8. The numbered compounds are as follows: I, hopene (desmethyl and 2-methyl); II, tetrahymanol (desmethyl, 2-methyl, and 20-methyl); III, triglycerides; IV, unidentified BHP; V, bacteriohopanetetrol (desmethyl and 2-methyl); VI, aminobacteriohopanetriol; VII, squalene. Retention times for each compound are listed in Table S1 in the supplemental material. At this point, we have not identified compound IV, and it remains unclear whether this is a true hopanoid product of R. palustris TIE-1 or a degradation product of the high-temperature hopanoid analysis method.
FIG. 3.
FIG. 3.
Δshc cells are more permeable to bile salts. The Δshc strain is unable to grow in the presence of bile salts (1.5%), while both the wild type and the Δshc complemented strain (Δshc+pPVW8) are resistant.
FIG. 4.
FIG. 4.
Δshc chemoheterotrophic growth and morphology. (A) Chemoheterotrophic growth of TIE-1 and the Δshc strain in unbuffered medium (A) or buffered medium (B) at pH 7. Each time point represents the average of three replicate cultures (the error bars represent standard deviations and may not be visible beneath the data point markers). Each growth curve was repeated at least three times, and representative growth curves are shown. The circled points in panel A indicate when cultures were harvested for transmission electron microscopy. (C) Transmission electron microscopy of chemoheterotrophically grown TIE-1 and Δshc cells harvested during mid-exponential growth (17 h after inoculation). (D) Transmission electron microscopy of chemoheterotrophically grown TIE-1 and Δshc cells harvested during stationary phase (72 h after inoculation). The arrows indicate the formation of the inner cytoplasmic membrane (lamellar membrane) as anoxic phototrophic growth was induced.
FIG. 5.
FIG. 5.
pH effect on Δshc chemoheterotrophic growth. Shown are chemoheterotrophic growth curves of the TIE-1 and Δshc strains in YP medium buffered at pH 5 (A), pH 6 (B), pH 8 (C), and pH 9 (D). Each time point represents the average of three replicate cultures (the error bars represent standard deviations and may not be visible beneath the data point markers). Each growth curve was repeated at least three times, and representative growth curves are shown.
FIG. 6.
FIG. 6.
pH effect on Δshc photoheterotrophic growth. Shown is photoheterotrophic growth of TIE-1 and Δshc strains in FW plus HEPES or FW plus MES medium supplemented with 10 mM sodium acetate under an N2 headspace buffered at pH 5.5 (A), pH 6.0 (B), pH 6.5 (C), pH 7.5 (D), pH 8.0 (E), and pH 8.5 (F). Each time point represents the average of three replicate cultures, and the error bars represent standard errors. Each growth curve was repeated at least three times, and representative growth curves are shown.
FIG. 7.
FIG. 7.
pH effect on shc expression. qRT-PCR was used to measure the expression levels of the shc gene after pH shock. (A) Chemoheterotrophically grown cells (pH 7) were incubated in YP medium buffered at pH 5, 6, 7, 8, or 9 for 30 min. (B) Photoheterotrophically grown cells (pH 6.5) were incubated in FW medium buffered at pH 6.5, 7.5, 8.0, or 8.5 for 30 min. The transcript levels of shc were determined for each sample as described in Materials and Methods. Each data bar represents the change in transcript levels at the indicated pH relative to the pH 7 sample (A) or the pH 6.5 sample (B). The change was graphed on a log2 scale, and a change greater than 2 or less than 0.5 was considered significant. Each data point represents the average of biological triplicates, and the error bars represent standard errors.

References

    1. Aono, R., and M. Ohtani. 1990. Loss of alkalophily in cell wall component defective mutants derived from alkalophilic Bacillus C-125. Isolation and partial characterization of the mutants. Biochem. J. 266:933-936. - PMC - PubMed
    1. Begley, M., C. G. Gahan, and C. Hill. 2005. The interaction between bacteria and bile. FEMS Microbiol. Rev. 29:625-651. - PubMed
    1. Benz, R., D. Hallmann, K. Poralla, and H. Eibl. 1983. Interaction of hopanoids with phosphatidylcholines containing oleic and omega cyclohexyldodecanoic acid in lipid bilayer membranes. Chem. Phys. Lipids 34:7-24. - PubMed
    1. Berry, A. M., O. T. Harriott, R. A. Moreau, S. F. Osman, D. R. Benson, and A. D. Jones. 1993. Hopanoid lipids compose the Frankia vesicle envelope, presumptive barrier of oxygen diffusion to nitrogenase. Proc. Natl. Acad. Sci. USA 90:6091-6094. - PMC - PubMed
    1. Bligh, E. G., and W. J. Dyer. 1959. A rapid method for total lipid extraction and purification. Can. J. Biochem. Physiol. 37:911-917. - PubMed

Publication types

MeSH terms