

Biomarkers for early and late stage chronic allograft nephropathy by proteogenomic profiling of peripheral blood
- PMID: 19593431
- PMCID: PMC2703807
- DOI: 10.1371/journal.pone.0006212
Biomarkers for early and late stage chronic allograft nephropathy by proteogenomic profiling of peripheral blood
Abstract
Background: Despite significant improvements in life expectancy of kidney transplant patients due to advances in surgery and immunosuppression, Chronic Allograft Nephropathy (CAN) remains a daunting problem. A complex network of cellular mechanisms in both graft and peripheral immune compartments complicates the non-invasive diagnosis of CAN, which still requires biopsy histology. This is compounded by non-immunological factors contributing to graft injury. There is a pressing need to identify and validate minimally invasive biomarkers for CAN to serve as early predictors of graft loss and as metrics for managing long-term immunosuppression.
Methods: We used DNA microarrays, tandem mass spectroscopy proteomics and bioinformatics to identify genomic and proteomic markers of mild and moderate/severe CAN in peripheral blood of two distinct cohorts (n = 77 total) of kidney transplant patients with biopsy-documented histology.
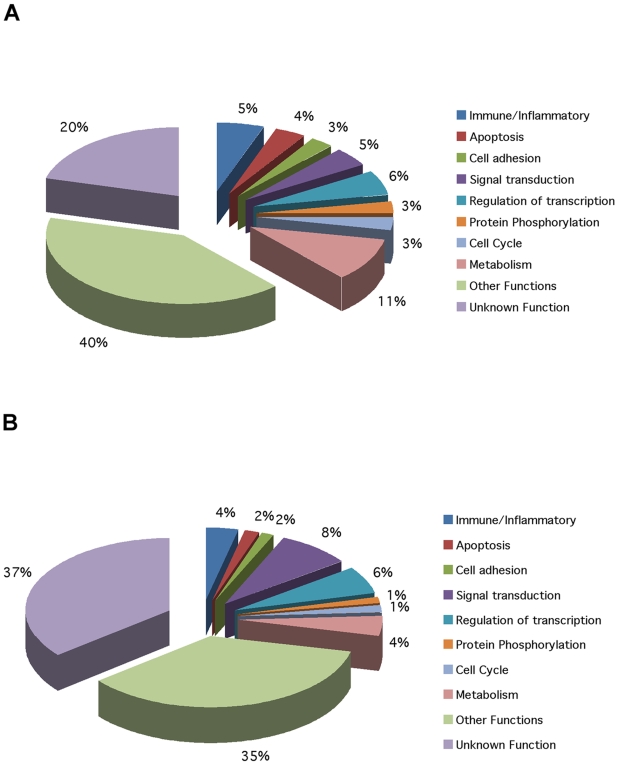
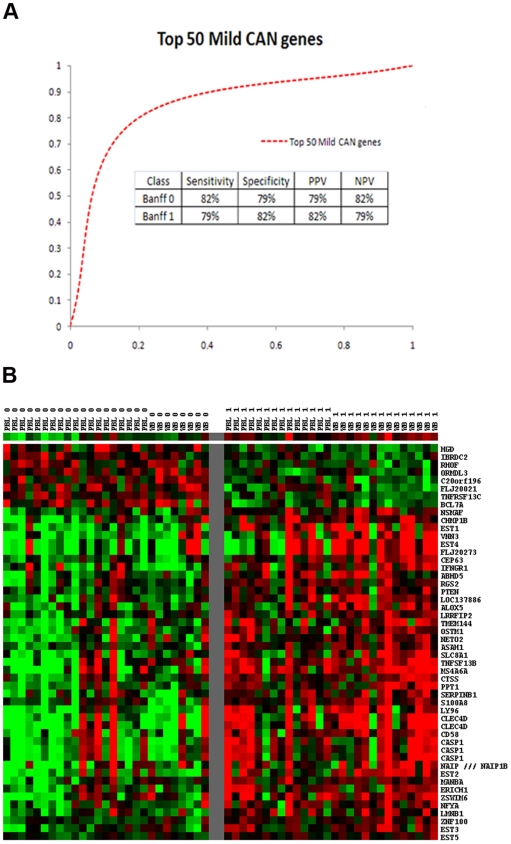
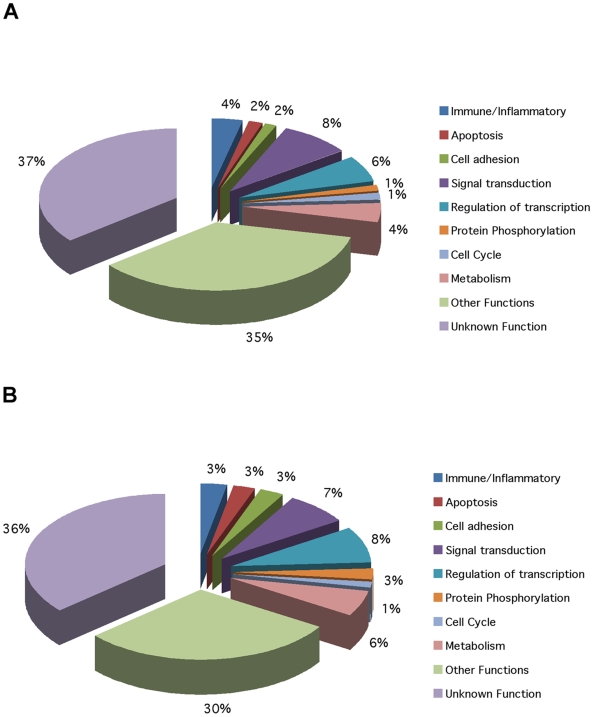
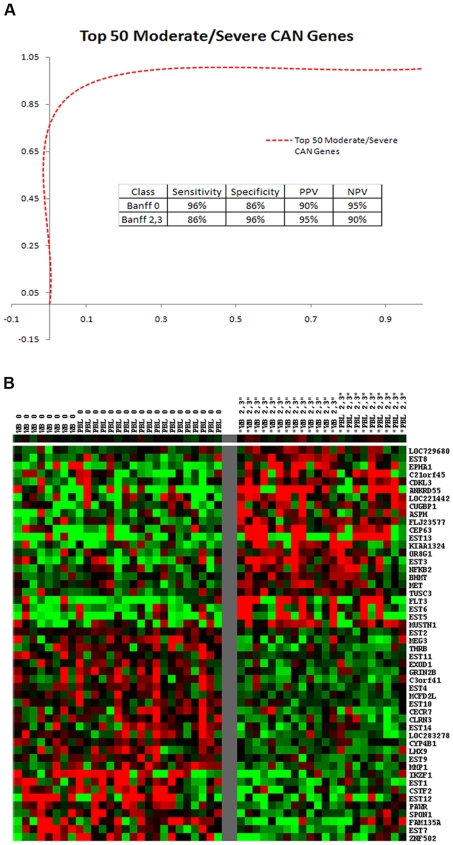
Findings: Gene expression profiles reveal over 2400 genes for mild CAN, and over 700 for moderate/severe CAN. A consensus analysis reveals 393 (mild) and 63 (moderate/severe) final candidates as CAN markers with predictive accuracy of 80% (mild) and 92% (moderate/severe). Proteomic profiles show over 500 candidates each, for both stages of CAN including 302 proteins unique to mild and 509 unique to moderate/severe CAN.
Conclusions: This study identifies several unique signatures of transcript and protein biomarkers with high predictive accuracies for mild and moderate/severe CAN, the most common cause of late allograft failure. These biomarkers are the necessary first step to a proteogenomic classification of CAN based on peripheral blood profiling and will be the targets of a prospective clinical validation study.
Conflict of interest statement
Figures
References
-
- Meier-Kriesche HU, Ojo AO, Port FK, Arndorfer JA, Cibrik DM, et al. Survival improvement among patients with end-stage renal disease: trends over time for transplant recipients and wait-listed patients. J Am Soc Nephrol. 2001;12:1293–1296. - PubMed
-
- Nankivell BJ, Borrows RJ, Fung CL, O'Connell PJ, Allen RD, et al. The natural history of chronic allograft nephropathy. N Engl J Med. 2003;349:2326–2333. - PubMed
-
- Pascual M, Theruvath T, Kawai T, Tolkoff-Rubin N, Cosimi AB. Strategies to improve long-term outcomes after renal transplantation. N Engl J Med. 2002;346:580–590. - PubMed
-
- Solez K, Colvin RB, Racusen LC, Haas M, Sis B, et al. Banff 07 classification of renal allograft pathology: updates and future directions. Am J Transplant. 2008;8:753–760. - PubMed
-
- Racusen LC, Solez K, Colvin RB, Bonsib SM, Castro MC, et al. The Banff 97 working classification of renal allograft pathology. Kidney Int. 1999;55:713–723. - PubMed
Publication types
MeSH terms
Substances
Grants and funding
LinkOut - more resources
Full Text Sources
Other Literature Sources
Medical
Molecular Biology Databases
