. 2009 Jul 13;4(7):e6226.
doi: 10.1371/journal.pone.0006226.

Modeling of the bacterial mechanism of methicillin-resistance by a systems biology approach

Affiliations

Modeling of the bacterial mechanism of methicillin-resistance by a systems biology approach

Ida Autiero et al. PLoS One. .

Abstract

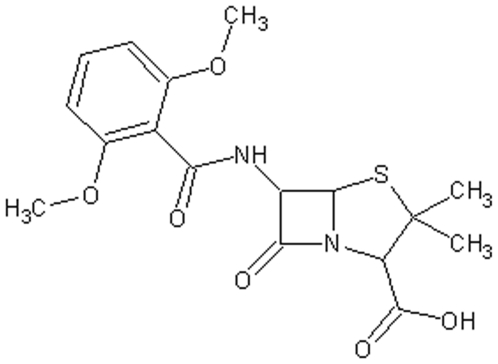
Background: A microorganism is a complex biological system able to preserve its functional features against external perturbations and the ability of the living systems to oppose to these external perturbations is defined "robustness". The antibiotic resistance, developed by different bacteria strains, is a clear example of robustness and of ability of the bacterial system to acquire a particular functional behaviour in response to environmental changes. In this work we have modeled the whole mechanism essential to the methicillin-resistance through a systems biology approach. The methicillin is a beta-lactamic antibiotic that act by inhibiting the penicillin-binding proteins (PBPs). These PBPs are involved in the synthesis of peptidoglycans, essential mesh-like polymers that surround cellular enzymes and are crucial for the bacterium survival.

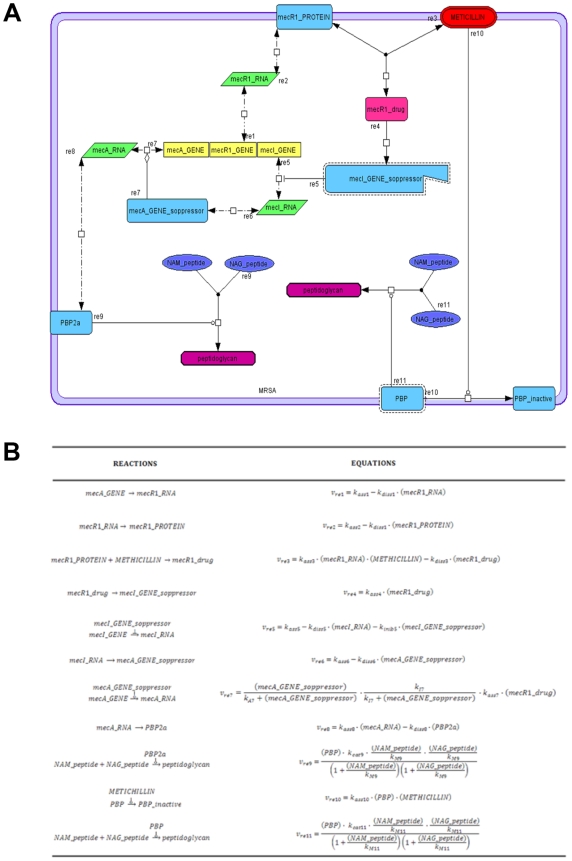
Methodology: The network of genes, mRNA, proteins and metabolites was created using CellDesigner program and the data of molecular interactions are stored in Systems Biology Markup Language (SBML). To simulate the dynamic behaviour of this biochemical network, the kinetic equations were associated with each reaction.

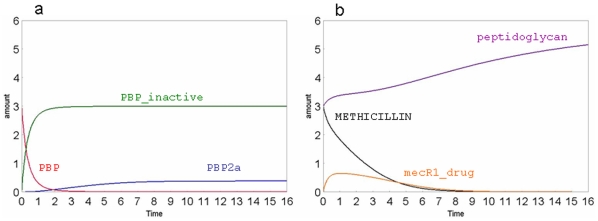
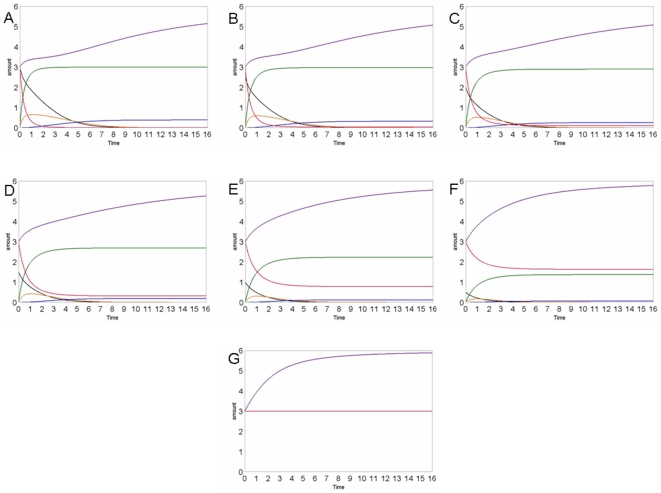
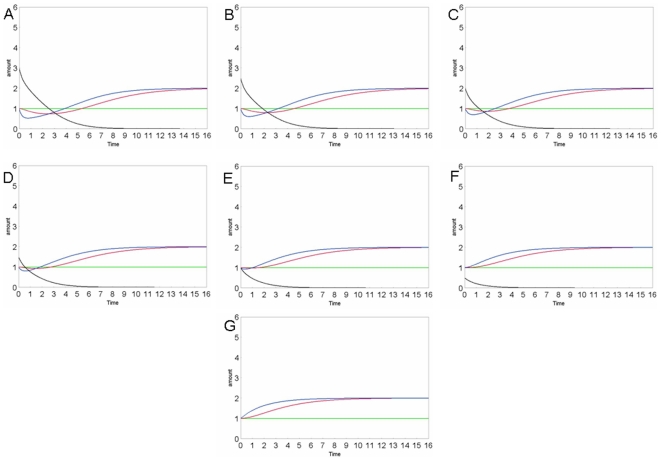
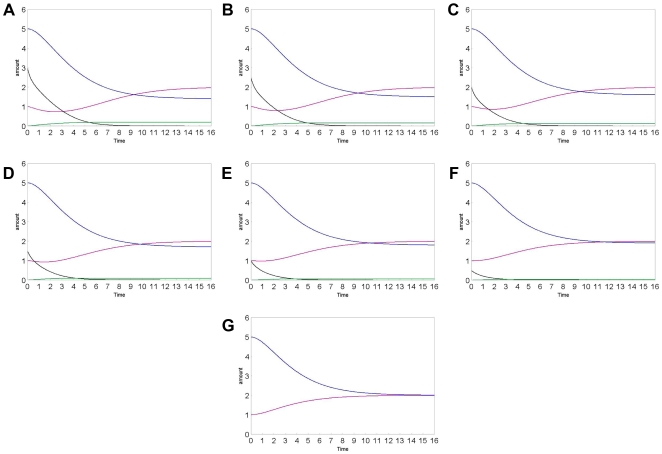
Conclusions: Our model simulates the mechanism of the inactivation of the PBP by methicillin, as well as the expression of PBP2a isoform, the regulation of the SCCmec elements (SCC: staphylococcal cassette chromosome) and the synthesis of peptidoglycan by PBP2a. The obtained results by our integrated approach show that the model describes correctly the whole phenomenon of the methicillin resistance and is able to respond to the external perturbations in the same way of the real cell. Therefore, this model can be useful to develop new therapeutic approaches for the methicillin control and to understand the general mechanism regarding the cellular resistance to some antibiotics.


Conflict of interest statement

Competing Interests: The authors have declared that no competing interests exist.

Figures

Figure 1
Figure 1. The methicillin structure.
Figure 2
Figure 2
A) Map model. Representation of the network connecting genes, RNAs, proteins and metabolites by using different forms and colours for some species. The frame in light violet represents the cellular membrane. B) Reactions and rate of the equations used in the model.
Figure 3
Figure 3. Simulation examples of our model.
Flux curves obtained for PBP, PBP-inactive and PBP2a (a), peptidoglycan, METHICILLIN, mecR1_drug (b). The substance amount and time are expressed in number of molecules and seconds, respectively.
Figure 4
Figure 4. Concentration curves of the various species: methicillin (black), peptidoglycan (violet), PBP (red), PBP2a (dark blue), PBP_inactive (green), mecR1_drug (orange), in different simulations, using different METHICILLIN amounts: A: 3; B: 2.5; C: 2; D: 1,5; E: 1; F: 0,5; G: 0.
The various species are distinguished by colours as indicated in the legend. The substance amount and time are expressed in number of molecules and seconds, respectively.
Figure 5
Figure 5. Concentration curves of the various species: methicillin (black), all genes (green), mecR1_protein (blue), mecR1_RNA (red), in different simulations, using different METHICILLIN amounts: A: 3; B: 2.5; C: 2; D: 1,5; E: 1; F: 0,5; G: 0.
The various species are distinguished by colours as indicated in the legend. The substance amount and time are expressed in number of molecules and seconds, respectively.
Figure 6
Figure 6. Concentration curves of the various species: methicillin (black), mecA_RNA (green), mecR1_RNA (purple), mecI_RNA (blue) in different simulations, using different METHICILLIN amounts: A: 3; B: 2.5; C: 2; D: 1,5; E: 1; F: 0,5; G: 0.
The various species are distinguished by colours as indicated in the legend. The substance amount and time are expressed in number of molecules and seconds, respectively.

References

    1. Lowy FD. Antimicrobial resistance: the example of Staphylococcus aureus. J Clin Invest. 2003;111:1265–1273. - PMC - PubMed
    1. Savic M, Ilic-Tomic T, Macmaster R, Vasiljevic B, Conn GL. Critical Residues for Cofactor Binding and Catalytic Activity in the Aminoglycoside Resistance Methyltransferase Sgm. J Bacteriol. 2008;190:5855–61. - PMC - PubMed
    1. Lehar J, Krueger A, Zimmermann G, Borisy A. High-order combination effects and biological robustness. Mol Syst Biol. 2008;4:215. - PMC - PubMed
    1. Brasch MA, Hartley JL, Vidal M. ORFeome cloning and systems biology: standardized mass production of the parts from the parts-list. Genome Res. 2004;14:2001–9. - PubMed
    1. Costantini S, Autiero I, Colonna G. On new challenge for the Bioinformatics. Bioinformation. 2008;3:238–239. - PMC - PubMed