

Intestinal gaboxadol absorption via PAT1 (SLC36A1): modified absorption in vivo following co-administration of L-tryptophan
- PMID: 19594759
- PMCID: PMC2765307
- DOI: 10.1111/j.1476-5381.2009.00253.x
Intestinal gaboxadol absorption via PAT1 (SLC36A1): modified absorption in vivo following co-administration of L-tryptophan
Abstract
Background and purpose: Gaboxadol has been in development for treatment of chronic pain and insomnia. The clinical use of gaboxadol has revealed that adverse effects seem related to peak serum concentrations. The aim of this study was to investigate the mechanism of intestinal absorption of gaboxadol in vitro and in vivo.
Experimental approach: In vitro transport investigations were performed in Caco-2 cell monolayers. In vivo pharmacokinetic investigations were conducted in beagle dogs. Gaboxadol doses of 2.5 mg.kg(-1) were given either as an intravenous injection (1.0 mL.kg(-1)) or as an oral solution (5.0 mL.kg(-1)).
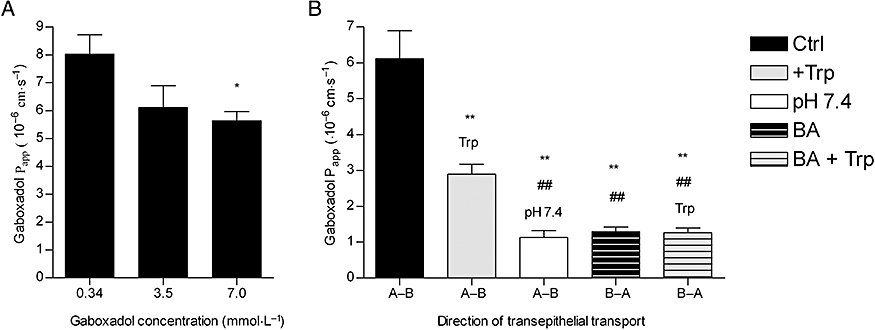
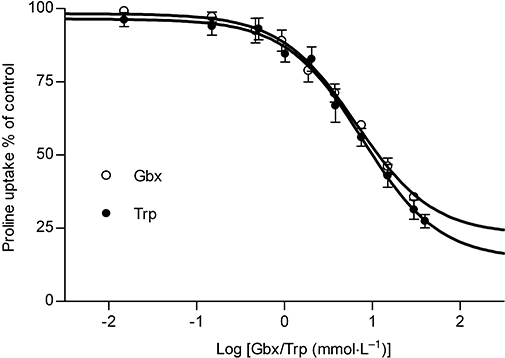
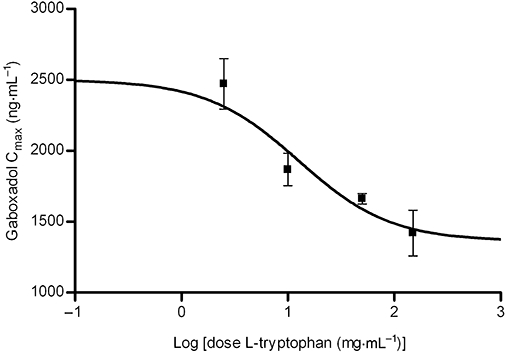
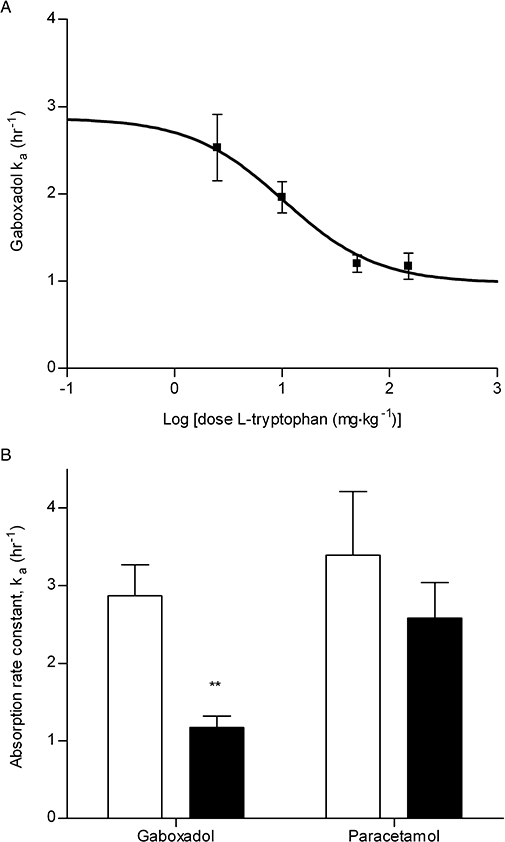
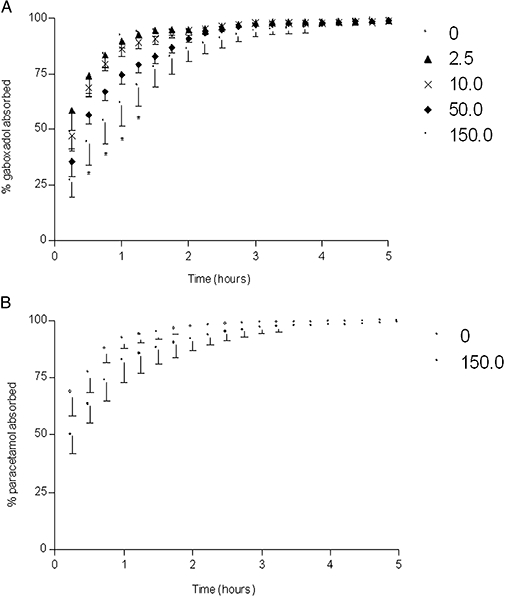
Key results: Gaboxadol may be a substrate of the human proton-coupled amino acid transporter, hPAT1 and it inhibited the hPAT1-mediated L-[(3)H]proline uptake in Caco-2 cell monolayers with an inhibition constant K(i) of 6.6 mmol.L(-1). The transepithelial transport of gaboxadol was polarized in the apical to basolateral direction, and was dependent on gaboxadol concentration and pH of the apical buffer solution. In beagle dogs, the absorption of gaboxadol was almost complete (absolute bioavailability, F(a), of 85.3%) and T(max) was 0.46 h. Oral co-administration with 2.5-150 mg.kg(-1) of the PAT1 inhibitor, L-tryptophan, significantly decreased the absorption rate constant, k(a), and C(max), and increased T(max) of gaboxadol, whereas the area under the curve and clearance of gaboxadol were constant.
Conclusions and implications: The absorption of gaboxadol across the luminal membrane of the small intestinal enterocytes is probably mediated by PAT1. This knowledge is useful for reducing gaboxadol absorption rates in order to decrease peak plasma concentrations.
Figures

Similar articles
-
The SLC36 family of proton-coupled amino acid transporters and their potential role in drug transport.Br J Pharmacol. 2011 Dec;164(7):1802-16. doi: 10.1111/j.1476-5381.2011.01438.x. Br J Pharmacol. 2011. PMID: 21501141 Free PMC article. Review.
-
Sertraline inhibits the transport of PAT1 substrates in vivo and in vitro.Br J Pharmacol. 2013 Nov;170(5):1041-52. doi: 10.1111/bph.12341. Br J Pharmacol. 2013. PMID: 23962042 Free PMC article.
-
Function and expression of the proton-coupled amino acid transporter PAT1 along the rat gastrointestinal tract: implications for intestinal absorption of gaboxadol.Br J Pharmacol. 2012 Oct;167(3):654-65. doi: 10.1111/j.1476-5381.2012.02030.x. Br J Pharmacol. 2012. PMID: 22577815 Free PMC article.
-
5-Hydroxy-L-tryptophan alters gaboxadol pharmacokinetics in rats: involvement of PAT1 and rOat1 in gaboxadol absorption and elimination.Eur J Pharm Sci. 2010 Jan 31;39(1-3):68-75. doi: 10.1016/j.ejps.2009.10.013. Epub 2009 Nov 10. Eur J Pharm Sci. 2010. PMID: 19900542
-
Deciphering the mechanisms of intestinal imino (and amino) acid transport: the redemption of SLC36A1.Biochim Biophys Acta. 2007 Feb;1768(2):179-97. doi: 10.1016/j.bbamem.2006.10.001. Epub 2006 Oct 7. Biochim Biophys Acta. 2007. PMID: 17123464 Review.
Cited by
-
Delta-aminolevulinic acid is a substrate for the amino acid transporter SLC36A1 (hPAT1).Br J Pharmacol. 2010 Mar;159(6):1339-53. doi: 10.1111/j.1476-5381.2009.00620.x. Epub 2010 Jan 27. Br J Pharmacol. 2010. PMID: 20128809 Free PMC article.
-
Rectal absorption of vigabatrin, a substrate of the proton coupled amino acid transporter (PAT1, Slc36a1), in rats.Pharm Res. 2012 Apr;29(4):1134-42. doi: 10.1007/s11095-012-0673-0. Epub 2012 Jan 11. Pharm Res. 2012. PMID: 22234618
-
The SLC36 family of proton-coupled amino acid transporters and their potential role in drug transport.Br J Pharmacol. 2011 Dec;164(7):1802-16. doi: 10.1111/j.1476-5381.2011.01438.x. Br J Pharmacol. 2011. PMID: 21501141 Free PMC article. Review.
-
Transport of the photodynamic therapy agent 5-aminolevulinic acid by distinct H+-coupled nutrient carriers coexpressed in the small intestine.J Pharmacol Exp Ther. 2010 Jan;332(1):220-8. doi: 10.1124/jpet.109.159822. Epub 2009 Sep 29. J Pharmacol Exp Ther. 2010. PMID: 19789362 Free PMC article.
-
The Concise Guide to PHARMACOLOGY 2013/14: transporters.Br J Pharmacol. 2013 Dec;170(8):1706-96. doi: 10.1111/bph.12450. Br J Pharmacol. 2013. PMID: 24528242 Free PMC article.
References
-
- Anderson CM, Grenade DS, Boll M, Foltz M, Wake KA, Kennedy DJ, et al. H+/Amino acid transporter 1 (PAT1) is the imino acid carrier: an intestinal nutrient/drug transporter in human and rat. Gastroenterology. 2004;127:1410–1422. - PubMed
-
- Boll M, Foltz M, Rubio-Aliaga I, Kottra G, Daniel H. Functional characterization of two novel mammalian electrogenic proton-dependent amino acid cotransporters. J Biol Chem. 2002;277:22966–22973. - PubMed
-
- Broer A, Klingel K, Kowalczuk S, Rasko JE, Cavanaugh J, Broer S. Molecular cloning of mouse amino acid transport system B0, a neutral amino acid transporter related to Hartnup disorder. J Biol Chem. 2004;279:24467–24476. - PubMed
MeSH terms
Substances
LinkOut - more resources
Full Text Sources
Other Literature Sources
Molecular Biology Databases
