

Metabolic profiling of Parkinson's disease: evidence of biomarker from gene expression analysis and rapid neural network detection
- PMID: 19594911
- PMCID: PMC2720938
- DOI: 10.1186/1423-0127-16-63
Metabolic profiling of Parkinson's disease: evidence of biomarker from gene expression analysis and rapid neural network detection
Abstract
Background: Parkinson's disease (PD) is a neurodegenerative disorder. The diagnosis of Parkinsonism is challenging because currently none of the clinical tests have been proven to help in diagnosis. PD may produce characteristic perturbations in the metabolome and such variations can be used as the marker for detection of disease. To test this hypothesis, we used proton NMR and multivariate analysis followed by neural network pattern detection.
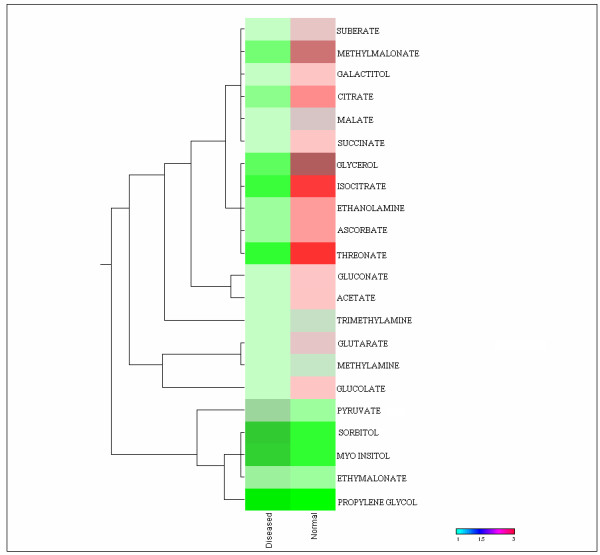
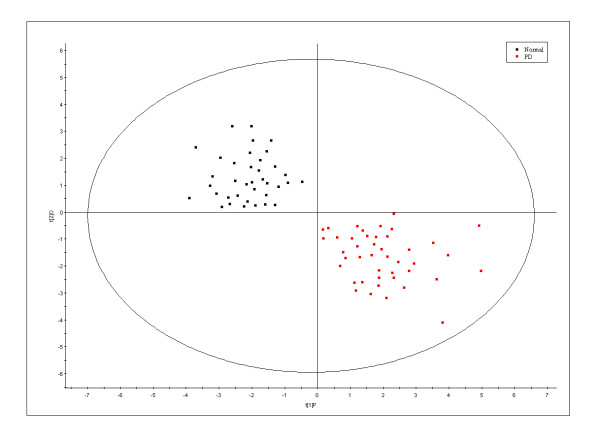
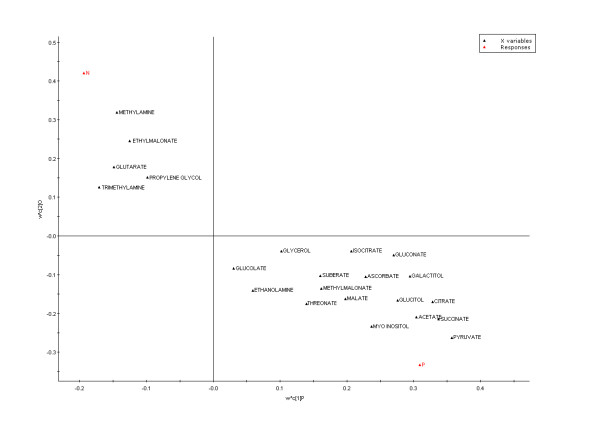
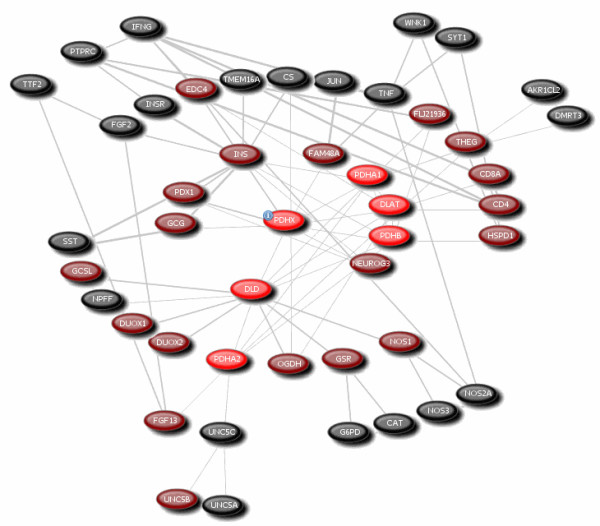
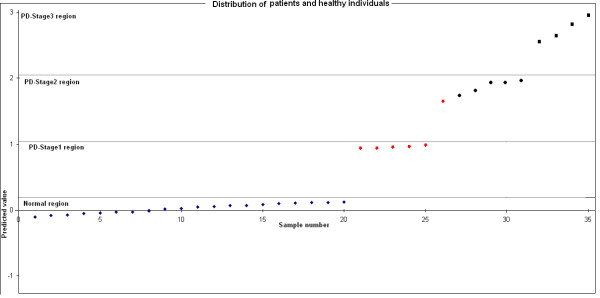
Methods & results: 1H nuclear magnetic resonance spectroscopy analysis was carried out on plasma samples of 37 healthy controls and 43 drug-naive patients with PD. Focus on 22 targeted metabolites, 17 were decreased and 5 were elevated in PD patients (p < 0.05). Partial least squares discriminant analysis (PLS-DA) showed that pyruvate is the key metabolite, which contributes to the separation of PD from control samples. Furthermore, gene expression analysis shows significant (p < 0.05) change in expression of PDHB and NPFF genes leading to increased pyruvate concentration in blood plasma. Moreover, the implementation of 1H- NMR spectral pattern in neural network algorithm shows 97.14% accuracy in the detection of disease progression.
Conclusion: The results increase the prospect of a robust molecular definition in detection of PD through the early symptomatic phase of the disease. This is an ultimate opening for therapeutic intervention. If validated in a genuinely prospective fashion in larger samples, the biomarker trajectories described here will go a long way to facilitate the development of useful therapies. Moreover, implementation of neural network will be a breakthrough in clinical screening and rapid detection of PD.
Figures
References
-
- Rango M, Canesi M, Ghione I, Farabola M, Righini A, Bresolin N, Antonini A, Pezzoli G. Parkinson's disease, chronic hydrocarbon exposure and striatal neuronal damage: A 1-H MRS study. Neurotoxicology. 2006;27:164–168. - PubMed
-
- Jankovic J. Pathophysiology and Clinical assessment of parkinsonian symptoms and signs. In: Pahwa R, Lyons K, Koller WC, editor. Handbook of Parkinson's disease. 3. Informa Health Care; 2003. pp. 71–98.
-
- The Movement Disorder Virtual University http://mdvu.org/library/ratingscales/pd/
-
- Rao G, Fisch L, Srinivasan S, Amico F, Okada T, Eaton C, Robbin C. Does this patient have Parkinson disease? JAMA. 2003;289:347–353. - PubMed
MeSH terms
Substances
LinkOut - more resources
Full Text Sources
Other Literature Sources
Medical
