

Higher infant blood lead levels with longer duration of breastfeeding
- PMID: 19595371
- PMCID: PMC3118670
- DOI: 10.1016/j.jpeds.2009.04.032
Higher infant blood lead levels with longer duration of breastfeeding
Abstract
Objective: To determine whether longer breastfeeding is associated with higher infant lead concentrations.
Study design: Data were analyzed from 3 studies of developmental effects of iron deficiency in infancy: Costa Rica (1981-1984), Chile (1991-1996), and Detroit (2002-2003). The relation between duration of breastfeeding and lead levels was assessed with Pearson product-moment or partial correlation coefficients.
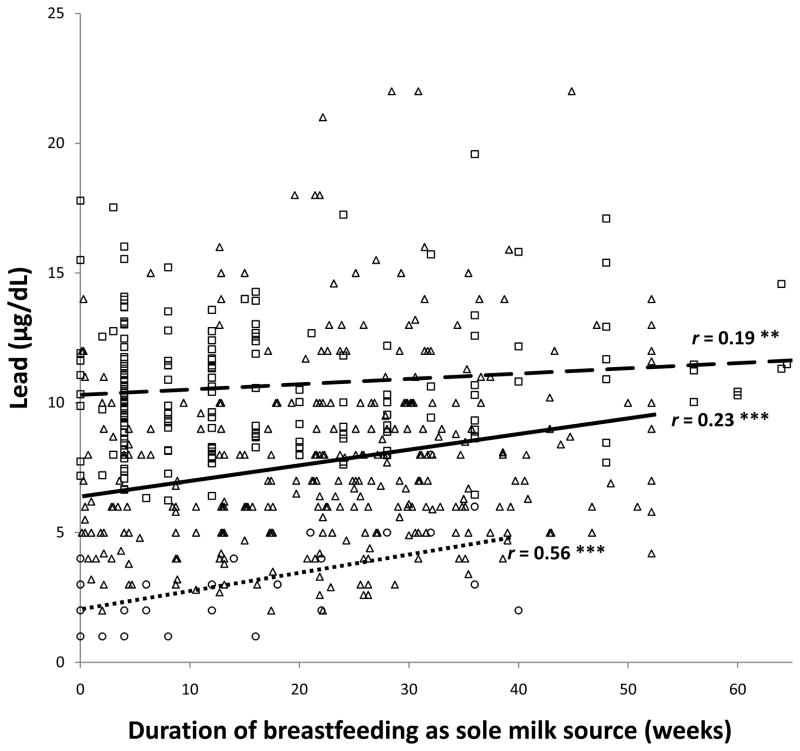
Results: More than 93% of the Costa Rica and Chile samples was breastfed (179 and 323 breastfed infants, respectively; mean weaning age, 8-10 months), as was 35.6% of the Detroit sample (53 breastfed infants; mean weaning age, 4.5 months). Lead concentrations averaged 10.8 microg/dL (Costa Rica, 12-23 months), 7.8 microg/dL (Chile, 12 months), and 2.5 microg/dL (Detroit, 9-10 months). Duration of breastfeeding as sole milk source and total breastfeeding correlated with lead concentration in all samples (r values = 0.14-0.57; P values = .06-<.0001).
Conclusions: Longer breastfeeding was associated with higher infant lead concentration in 3 countries, in 3 different decades, in settings differing in breastfeeding patterns, environmental lead sources, and infant lead levels. The results suggest that monitoring lead concentrations in breastfed infants be considered.
Conflict of interest statement
Figures
 , Chile
 , Detroit
 ) along with the Pearson correlation coefficient for Chile and partial correlation coefficients for Costa Rica and Detroit. ** p < .01, *** p < .001
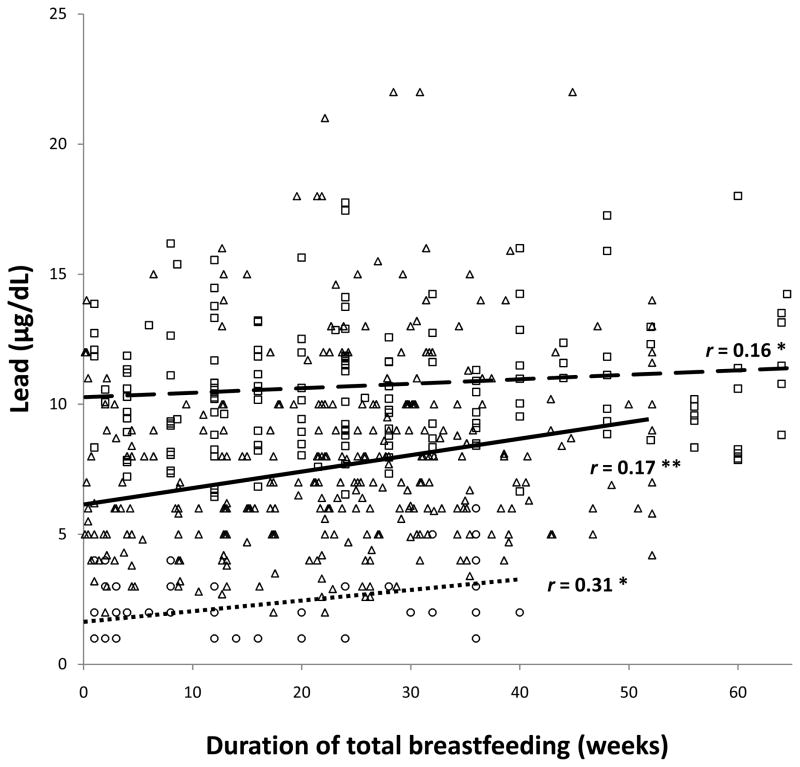 , Chile
, Detroit
) along with the Pearson correlation coefficient for Chile and partial correlation coefficients for Costa Rica and Detroit. * p < .05, ** p < .01
, Chile
, Detroit
) along with the Pearson correlation coefficient for Chile and partial correlation coefficients for Costa Rica and Detroit. * p < .05, ** p < .01Comment in
-
Breast-feeding and child lead exposure: a cause for concern.J Pediatr. 2009 Nov;155(5):610-1. doi: 10.1016/j.jpeds.2009.05.035. J Pediatr. 2009. PMID: 19840613 No abstract available.
References
-
- Manton W, Angle C, Stanek K, Kuntzelman D, Reese Y, Kuehnemann T. Release of lead from bone in pregnancy and lactation. Environ Res. 2003;92:139–51. - PubMed
-
- Gulson B, Mizon K, Korsch M, Palmer J, Donnelly J. Mobilization of lead from human bone tissue during pregnancy and lactation--a summary of long-term research. Sci Total Environ. 2003;303:79–104. - PubMed
-
- Rabinowitz M, Leviton A, Needleman H. Lead in milk and infant blood: a dose-response model. Arch Environ Health. 1985;40(5):283–6. - PubMed
-
- Gundacker C, Pietschnig B, Wittmann KJ, Lischka A, Salzer H, Hohenauer L, et al. Lead and mercury in breast milk. Pediatrics. 2002;110(5):873–8. - PubMed
