. 2009 Jul 10;138(1):114-28.
doi: 10.1016/j.cell.2009.04.020.

A unifying model for the selective regulation of inducible transcription by CpG islands and nucleosome remodeling

Affiliations

A unifying model for the selective regulation of inducible transcription by CpG islands and nucleosome remodeling

Vladimir R Ramirez-Carrozzi et al. Cell. .

Abstract

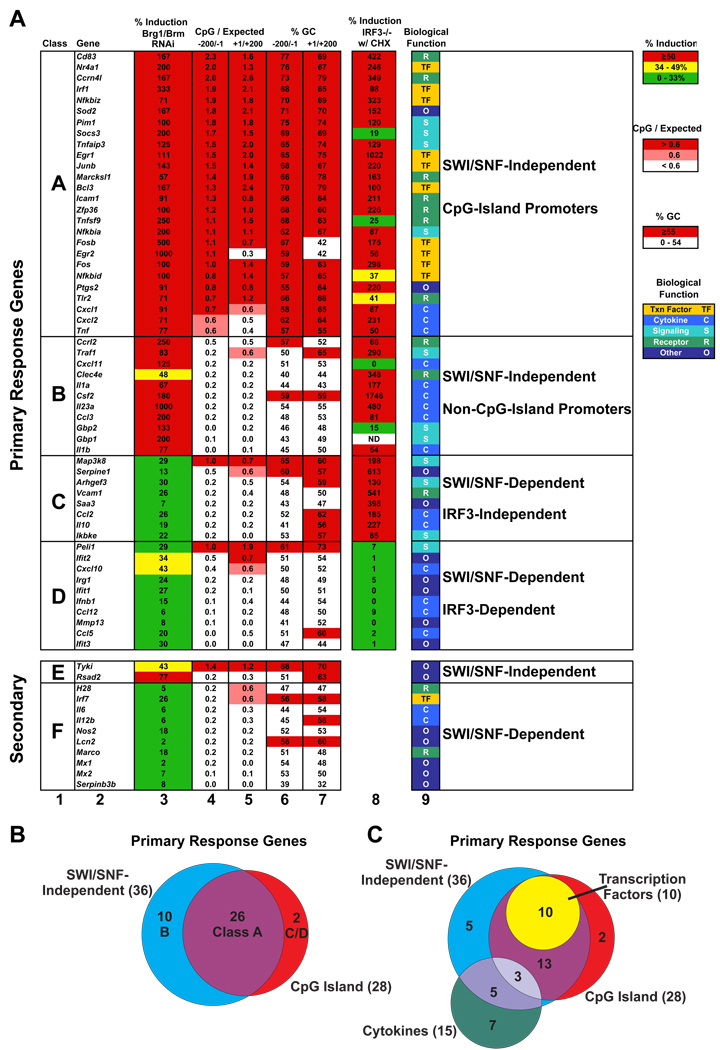
We describe a broad mechanistic framework for the transcriptional induction of mammalian primary response genes by Toll-like receptors and other stimuli. One major class of primary response genes is characterized by CpG-island promoters, which facilitate promiscuous induction from constitutively active chromatin without a requirement for SWI/SNF nucleosome remodeling complexes. The low nucleosome occupancy at promoters in this class can be attributed to the assembly of CpG islands into unstable nucleosomes, which may lead to SWI/SNF independence. Another major class consists of non-CpG-island promoters that assemble into stable nucleosomes, resulting in SWI/SNF dependence and a requirement for transcription factors that promote selective nucleosome remodeling. Some stimuli, including serum and tumor necrosis factor-alpha, exhibit a strong bias toward activation of SWI/SNF-independent CpG-island genes. In contrast, interferon-beta is strongly biased toward SWI/SNF-dependent non-CpG-island genes. By activating a diverse set of transcription factors, Toll-like receptors induce both classes and others for an optimal response to microbial pathogens.


Figures

Figure 1
Figure 1. Classification of LPS-Induced Primary- and Secondary-Response Genes
(A) 67 genes that are potently induced by LPS in mouse bone marrow-derived macrophages are shown. Classes A–D are primary response genes (resistant to CHX) and Classes E and F are secondary response genes (sensitive to CHX). Column 3 shows the effect of Brg1/Brm knockdown on LPS-induced mRNA levels as a percentage of the mRNA level observed in control cells (set at 100% for each gene), as determined by qRT-PCR. Column 8 shows mRNA levels in IRF3−/− macrophages stimulated with LPS in the presence of CHX as a percentage of mRNA levels in LPS-stimulated wild-type C57BL/6 macrophages, as determined by qRT-PCR. In columns 3 and 8, percentages represent the average of three independent experiments. Columns 4 and 5 show the ratio of the number of observed CpGs to the number expected if CpGs were randomly distributed, for the regions from −200 to −1 (column 4) and +1 to +200 (column 5) relative to the start site indicated in the DBTSS database. Columns 6 and 7 show percentages of GC bps in these same regions. Column 9 shows the established or predicted functions of the 67 genes. Color-coded legends for columns 3 through 9 are shown at the right. (B) A Venn diagram shows that 26 of 28 primary response genes containing CpG-island promoters are induced in a SWI/SNF-independent manner. (C) A Venn diagram shows that all 10 primary response genes encoding transcription factors are contained within Class A, whereas only 3 of 15 cytokine genes are found in this class.
Figure 2
Figure 2. Constitutively Active Chromatin is Preferentially Found at LPS-Induced CpG-Island Promoters
ChIP was used to monitor chromatin structure at 37 LPS-induced genes and two housekeeping genes (Gapd and Actb) in unstimulated bone marrow-derived macrophages. Genes containing CpG-island and non-CpG-island promoters are in red and black, respectively. Antibodies against unmodified histone H3, H3K9/K14ac, H3K4me3, RNA polymerase II, and TBP were examined. PCR primer pairs were normalized using genomic DNA. Normalized results are shown as a percentage of input values. Higher values were obtained with the modified histone antibodies than with the unmodified histone antibodies due to different antibody qualities. The results are averages of 3 independent experiments performed with independent chromatin preparations, with standard deviations. P-values for the differences between CpG-island and non-CpG-island promoters were: histone H3, p<0.002; H3K9/14ac, p<0.001; H3K4me3, p<0.00004; RNA polymerase II, p<0.002; and TBP, p<0.001.
Figure 3
Figure 3. CpG-Island Promoters Compete Less Effectively than Non-CpG-Island Promoters for Nucleosome Assembly In Vitro
(A) A sequential assembly and amplification assay was used to compare the stabilities of nucleosomes assembled on CpG-island and non-CpG-island promoters. 300-bp DNA fragments were pooled from 23 LPS-induced promoters, 3 housekeeping promoters (Gapd, Actb, and Dhfr), and a synthetic DNA fragment previously shown to assemble into unusually stable nucleosomes (601; Lowary and Widom, 1998). After assembly into nucleosomes with recombinant histones and separation of nucleosomal fragments from free fragments by gel shift, the nucleosomal and free fragments were isolated. A portion of each resulting pool was re-assembled, with another portion used for qPCR to determine the relative amount of each DNA fragment in each pool. Four rounds of assembly, elution, and amplification were performed. (B) The ratio of each promoter fragment found in the nucleosomal (bound) band to the free band in the gel shift experiments after each assembly and elution cycle is shown. CpG-island promoters are in red and non-CpG-island promoters in black. The Cxcl10 fragment used for this analysis is depicted as a CpG-island, although the Cxcl10 promoter from −1 to −200 contains an observed:expected CpG ratio of only 0.4 (Figure 1). The reason for this difference is that the 300-bp fragment used for in vitro assembly extends into the CpG-rich transcribed region (−161/+139) and, with the adaptor, possesses a CpG ratio of 0.7. The P-value for the difference between CpG-island and non-CpG-island promoters is p<0.01.
Figure 4
Figure 4. IRF3 is Required for Nucleosome Remodeling at Class D Promoters
(A) Macrophages from C57BL/6 mice and IRF3−/− mice were stimulated with LPS in the presence of CHX. mRNA levels for the Ccl5 and Ifit1 genes were strongly reduced in the IRF3−/− cells. (B) Restriction enzyme accessibility at the Ccl5 promoter was monitored using a Southern blot assay. Results are shown from three independent experiments, with the average percentage of alleles cleaved in the nuclei shown in the bar graph. The larger DNA fragment (*) results from cleavage of the purified genomic DNA by EcoRI and HindIII, which cleave sites flanking the Ccl5 promoter. The smaller fragment (arrow) was generated when EcoNI, which was added to the isolated nuclei, cleaved within the Ccl5 promoter. (C) Restriction enzyme accessibility was monitored at the Ifit1 promoter, as described above for the Ccl5 promoter. Results from two independent experiments are shown. DraIII was used for digestion of purified DNA at sites flanking the Ifit1 promoter, with DraI used for digestion of nuclear DNA within the Ifit1 promoter.
Figure 5
Figure 5. Preferential Activation of CpG-Island and Non-CpG-Island Genes by TNFα and IFNβ
(A) Bone marrow-derived macrophages were left unstimulated or were stimulated for 30 min, 1 hr, or 2 hrs with stimuli for TLR2, TLR3, or TLR4, or with IFNβ or TNFα. mRNA levels for 61 of the 67 genes shown in Figure 1 were monitored by qRT-PCR. mRNA levels are presented as a percentage of the highest level observed at any of the time points by any of the stimuli (set at 100%). Values represent an average of three independent experiments (i.e. independent stimulations of independent macrophage preparations). mRNA levels of at least 15% of the maximum were colored red (> 50%), orange (33–49%), or yellow (15–32%). CpG numbers, Brg1/Brm-dependence, and IRF3-dependence were derived from Figure 1. (B) A Venn diagram shows that TNFα preferentially induced a high percentage of CpG-island genes (mostly in Class A), whereas IFNβ preferentially induced non-CpG-island genes (mostly in Classes C and D). (C) The number of genes within each of the 6 classes that were induced or were not induced by IFNβ and TNFα are depicted in a bar graph. Uninduced genes were defined as those induced to a level below 15% of the maximum induction by any of the 5 stimuli shown in panel A.
Figure 6
Figure 6. Differential Induction of CpG-Island Versus Non-CpG-Island Genes
(A) A collection of well-characterized primary response genes induced by serum is shown, along with the CpG-content and GC-content of their promoters. The list includes every serum-induced gene described in Herschman (1991). (B) A collection of well-characterized primary response genes induced by TPA is shown, along with the CpG-content and GC-content of their promoters. Every TPA-induced gene described in Herschman (1991) is included. (C) A set of primary response genes induced by IFNβ in mouse bone marrow-derived macrophages is shown. The list includes all genes from the set of 67 LPS-induced genes that were induced by IFNβ by at least 5-fold in qRT-PCR experiments.
Figure 7
Figure 7. Il6 is SWI/SNF-Independent in LPS-Stimulated MEFs
(A) Il6 mRNA levels were monitored by qRT-PCR in J774 macrophages or primary MEFs following stimulation with LPS in the presence of CHX or in the presence of the DMSO solvent. Results shown are averages of three independent experiments, with standard deviations. The CHX-sensitivity observed in the J774 line was also observed in primary bone marrow-derived macrophages (Ramirez-Carrozzi et al., 2006). (B) Restriction enzyme accessibility at the Il6 promoter was examined in J774 macrophages and primary MEFs as described (Ramirez-Carrozzi et al., 2006). Cells were left unstimulated or were stimulated for different time periods. Cells were also stimulated for 120 min in the presence of CHX. (C) An shRNA that simultaneously targets the Brg1 and Brm mRNAs for degradation was introduced into primary MEFs using a retroviral vector (Ramirez-Carrozzi et al., 2006). Efficient knockdown of Brg1 and Brm was monitored by Western blot (data not shown). Cells were stimulated with LPS and Il6 mRNA levels were monitored by qRT-PCR. Results represent averages of three independent experiments.

Comment in

References

    1. Agalioti T, Lomvardas S, Parekh B, Yie J, Maniatis T, Thanos D. Ordered recruitment of chromatin modifying and general transcription factors to the IFN-beta promoter. Cell. 2000;103:667–678. - PubMed
    1. Anderson JD, Widom J. Poly(dA-dT) promoter elements increase the equilibrium accessibility of nucleosomal DNA target sites. Mol. Cell. Biol. 2001;21:3830–3839. - PMC - PubMed
    1. Boeger H, Griesenbeck J, Kornberg RD. Nucleosome retention and the stochastic nature of promoter chromatin remodeling for transcription. Cell. 2008;133:716–726. - PMC - PubMed
    1. Boyle AP, Davis S, Shulha HP, Meltzer P, Margulies EH, Weng Z, Furey TS, Crawford GE. High-resolution mapping and characterization of open chromatin across the genome. Cell. 2008;132:311–322. - PMC - PubMed
    1. Cui K, Tailor P, Liu H, Chen X, Ozato K, Zhao K. The chromatin-remodeling BAF complex mediates cellular antiviral activities by promoter priming. Mol. Cell. Biol. 2004;24:4476–4486. - PMC - PubMed

Publication types

Substances