. 2009 Jul 10;138(1):129-45.
doi: 10.1016/j.cell.2009.05.047.

Control of inducible gene expression by signal-dependent transcriptional elongation

Affiliations

Control of inducible gene expression by signal-dependent transcriptional elongation

Diana C Hargreaves et al. Cell. .

Abstract

Most inducible transcriptional programs consist of primary and secondary response genes (PRGs and SRGs) that differ in their kinetics of expression and in their requirements for new protein synthesis and chromatin remodeling. Here we show that many PRGs, in contrast to SRGs, have preassembled RNA polymerase II (Pol II) and positive histone modifications at their promoters in the basal state. Pol II at PRGs generates low levels of full-length unspliced transcripts but fails to make mature, protein-coding transcripts in the absence of stimulation. Induction of PRGs is controlled at the level of transcriptional elongation and mRNA processing, through the signal-dependent recruitment of P-TEFb. P-TEFb is in turn recruited by the bromodomain-containing protein Brd4, which detects H4K5/8/12Ac inducibly acquired at PRG promoters. Our findings suggest that the permissive structure of PRGs both stipulates their unique regulation in the basal state by corepressor complexes and enables their rapid induction in multiple cell types.


Figures
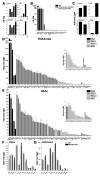
Figure 1
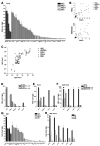
Figure 1. Primary response genes are permissive at the basal state
(A) Bone marrow-derived macrophages (BMMΦs) were treated for 1, 2, or 3 hours with LPS, or 2 hours with LPS+CHX, and analyzed by RT-qPCR. (B) Expression of housekeeping (HKG) and LPS-inducible genes in unstimulated BMMΦs was analyzed by RT-qPCR. (C) BMMΦs were stimulated for 4 hours and analyzed by ChIP (H3K4me3). (D, E) BMMΦs were analyzed by ChIP (H3K4me3, H3Ac). Genes are shaded and ranked as housekeeping (HKG), CpG-rich primary (PRG-I), CpG-poor primary (PRG-II), or secondary (SRG). Graphs magnifying the lower end of the spectrum are shown to the right. (F, G) WT and MyD88/TRIF−/− BMMΦs were analyzed by ChIP (H3Ac, H3K4me3). (A–G) Data are representative of 3 or more independent experiments. Error bars represent mean+/−SEM.
Figure 2
Figure 2. Signal-independent transcription initiation of PRG-Is
(A) BMMΦs were analyzed by ChIP (Pol II). (B) Pol II values (Figure 2A) were graphed against H3Ac or H3K4me3 values (Figure 1D, E). (C) BMMΦs were analyzed by ChIP (S5P Pol II, S2P Pol II). (D) WT and MyD88/TRIF−/− BMMΦs were analyzed by ChIP (S5P Pol II, S2P Pol II). (E, F) WT and MyD88/TRIF−/− BMMΦs were stimulated for 1 hour with LPS and analyzed by ChIP (Pol II, S5P Pol II). (G) BMMΦs were analyzed by ChIP (Sp1). (H) Mouse embryonic fibroblasts (MEFs) were transfected with siRNA oligos targeted to Sp1 (d1,d2) or a scrambled control oligo (sc) and analyzed by ChIP (S5P Pol II). (A–H) Data are representative of 3 or more independent experiments. Error bars represent mean+/−SEM.
Figure 3
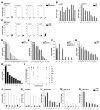
Figure 3. PRG-I transcription is regulated at the level of transcriptional elongation and processing
(A) WT and MyD88/TRIF−/− BMMΦs were stimulated for 1 hour with LPS and analyzed by ChIP at the 3′ end of the gene (S2P Pol II). (B) BMMΦs were stimulated for 1 hour with LPS and analyzed by ChIP (cdk9, cyclin T1). (C) BMMΦs were left untreated (white bars) or treated with DRB (black bars) and then stimulated with LPS for 1 hour and analyzed by ChIP at the 3′ end of the gene (S2P Pol II). (D) BMMΦs were analyzed by RT-qPCR for precursor (within an exon) and spliced (crosses an intron) transcripts. (E) WT and MyD88/TRIF−/− BMMΦs were analyzed by RT-qPCR for precursor transcripts. (F) WT and MyD88/TRIF−/− BMMΦs were stimulated for 1 hour with LPS and analyzed by RT-qPCR for spliced transcripts. (G) BMMΦs were left untreated (white bars) or treated with DRB (black bars) and then analyzed by RT-qPCR for unspliced transcripts (exon to intron). (H) BMMΦs were analyzed by ChIP (S5P Pol II) at the 3′ end of the gene. (I) BMMΦs were left untreated or treated with ActD for the indicated times and analyzed by RT-qPCR for precursor transcripts. (J–M) BMMΦs were treated with or without ActD for 12 hours and analyzed by ChIP (H3K4me3, H3K9Ac, H3K27me3, S5P Pol II). (N) BMMΦs were treated with or without ActD for 2 hours and analyzed by ChIP (S5P Pol II). (A–N) Data are representative of 3 or more independent experiments. Error bars represent mean+/−SEM.
Figure 4
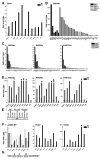
Figure 4. Brd4 is recruited to PRG promoters following inducible acetylation of H4K5/8/12
(A) BMMΦs were stimulated for 1 hour with LPS and analyzed by ChIP (Brd4). (B, C) BMMΦs were analyzed by ChIP (H3K9Ac, H4K5Ac, H4K8Ac, H4K12Ac). (D) BMMΦs were stimulated for 1 hour with LPS and analyzed by ChIP (H4K5Ac, H4K8Ac, H4K12Ac). (E) Histone peptide binding assays were performed with GST fusion proteins of bromodomain 1 or 2 of Brd4 (BD1, BD2) and either no peptide, AcH4 peptide, or unmodified H4 peptide. Reactions were analyzed by Western blotting with anti-GST. (F) BMMΦs were stimulated for 1 hour with LPS and analyzed by ChIP (p300/CBP, PCAF, GCN5). (G) Schematic of the H4 tail. (A–F) Data are representative of 3 or more independent experiments. Error bars represent mean+/−SEM.
Figure 5
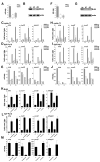
Figure 5. Brd4 is required for P-TEFb recruitment to PRGs
(A, F) BMMΦs (A) or MEFs (F) were transfected with siRNA oligos targeted to Brd4 (d1,d2) or a scrambled control oligo (sc), and analyzed by RT-qPCR for Brd4 expression. (B, G) BMMΦs (F) or MEFs (G) were transfected as in (A) and nuclear lysates were analyzed by Western blotting for Brd4 or actin. (C–J) BMMΦs (C–E) or MEFs (H–J) were transfected as in (A), stimulated for 1 or 2 hours with LPS (BMMΦs) or IL-1 (MEFs) and analyzed by (C, D and H, I) ChIP (cyclin T1, S2P Pol II) or (E, J) RT-qPCR. (K–M) MEFs were treated with H4K5/12Ac or unacetylated H4 (unAcH4) peptides, stimulated for 1 hour with IL-1 and analyzed by (K, L) ChIP (Brd4, S2P Pol II) or (M) RT-qPCR. (A–M) Data are representative of 3 or more independent experiments. Error bars represent mean+/−SEM.
Figure 6
Figure 6. Signal-dependent NF-κB activation is required for inducible H4K5/8/12 acetylation, Brd4 recruitment and P-TEFb recruitment
(A) BMMΦs were stimulated for 1 or 2 hours with LPS and analyzed by ChIP (p65). (B–G) BMMΦs were left untreated (white bars) or treated with BAY-11087 (black bars), stimulated with LPS for 1 or 2 hours, and analyzed by (B) RT-qPCR or by (C–G) ChIP at the 3′ end (total Pol II) or at the TSS (GCN5, H4K5Ac, H4K12Ac, Brd4, cyclin T1). . ND indicates not done. (H, I) BMMΦs were treated with or without BAY-11087 and NF-κB inhibitor II and analyzed by ChIP (total Pol II, S5P Pol II, H3K9Ac, H3K4me3). (J) BMMΦs from wild-type and NEMOflox/flox mice were transduced with mock retrovirus or retrovirus expressing Cre. Cre-expressing (WT Cre, Nemo Cre) and non-expressing (WT mock, Nemo mock) cells were stimulated for 1 hour with LPS and analyzed by ChIP (S2P Pol II). (K) Wild-type and NEMOflox/flox BMMΦs were transduced as in (J) and Cre-expressing cells were stimulated for 1 hour with LPS and analyzed by RT-qPCR. (A–K) Data are representative of 3 or more independent experiments. Error bars represent mean+/−SEM.
Figure 7
Figure 7. Implications for the inducible regulation of PRG-1 expression
(A–E) BMMΦs were stimulated for 1 hour with LPS and analyzed by ChIP (NCoR, CoREST, HDAC1, HDAC3, p50). Error bars represent mean of triplicate values+/−SEM. (F) MEFs were stimulated with IL-1 for 1 hour and analyzed by RT-qPCR. This data and data from three published microarrays was graphed as the number of genes induced following stimulation in MEFs, HUVECs, or Keratinocytes of macrophage LPS-inducible PRG-I and PRG-II/SRGs. A list of analyzed genes appears in Supplemental Table 1. (G) MEFs were analyzed by ChIP (H3K4me3, H3K9Ac, S5P Pol II, Sp1). Data is graphed as the number of genes in MEFs that are similar in H3K4me3, H3K9Ac, S5P Pol II, or Sp1 status to those genes in macrophages for either PRG-I or PRG-II genes. (H) Model of LPS-induced PRG-I transcription (see text for description). Squares indicate acetylated residues, circles indicate methylated residues, and stars indicate phosphorylated residues.

Comment in

References

    1. Agalioti T, Chen G, Thanos D. Deciphering the transcriptional histone acetylation code for a human gene. Cell. 2002;111:381–392. - PubMed
    1. Baek SH, Ohgi KA, Rose DW, Koo EH, Glass CK, Rosenfeld MG. Exchange of N-CoR corepressor and Tip60 coactivator complexes links gene expression by NF-kappaB and beta-amyloid precursor protein. Cell. 2002;110:55–67. - PubMed
    1. Barboric M, Nissen RM, Kanazawa S, Jabrane-Ferrat N, Peterlin BM. NF-kappaB binds P-TEFb to stimulate transcriptional elongation by RNA polymerase II. Mol Cell. 2001;8:327–337. - PubMed
    1. Bentley DL, Groudine M. A block to elongation is largely responsible for decreased transcription of c-myc in differentiated HL60 cells. Nature. 1986;321:702–706. - PubMed
    1. Chi T. A BAF-centred view of the immune system. Nat Rev Immunol. 2004;4:965–977. - PubMed

Publication types