. 2009 Jul 10;138(1):172-85.
doi: 10.1016/j.cell.2009.04.031.

Myelin gene regulatory factor is a critical transcriptional regulator required for CNS myelination

Affiliations

Myelin gene regulatory factor is a critical transcriptional regulator required for CNS myelination

Ben Emery et al. Cell. .

Abstract

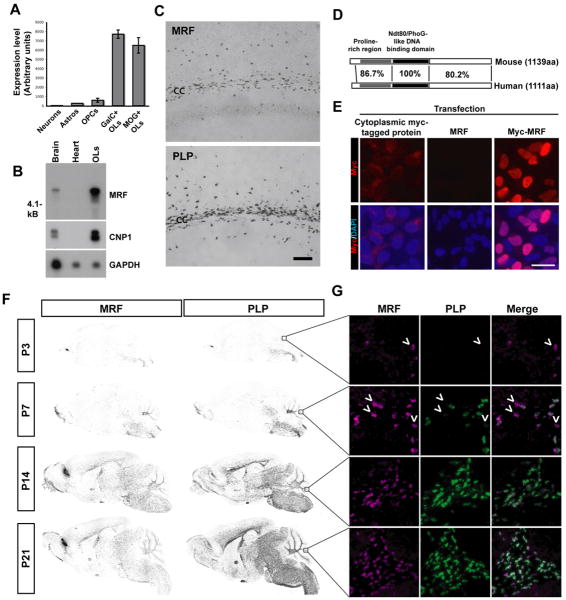
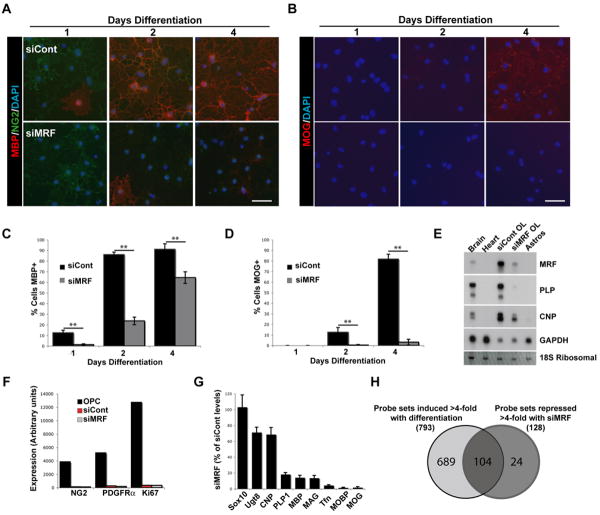
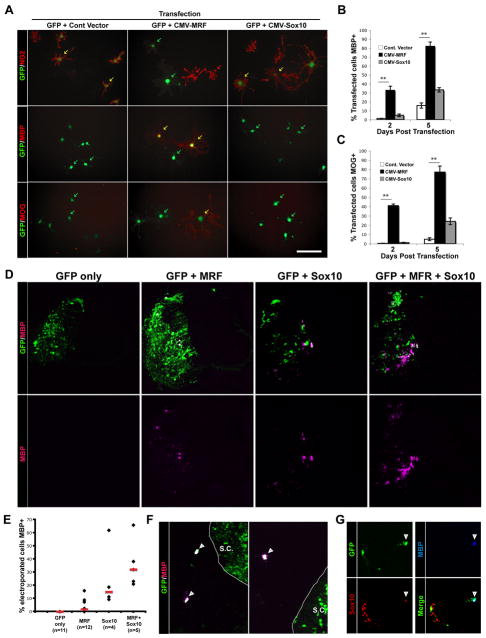
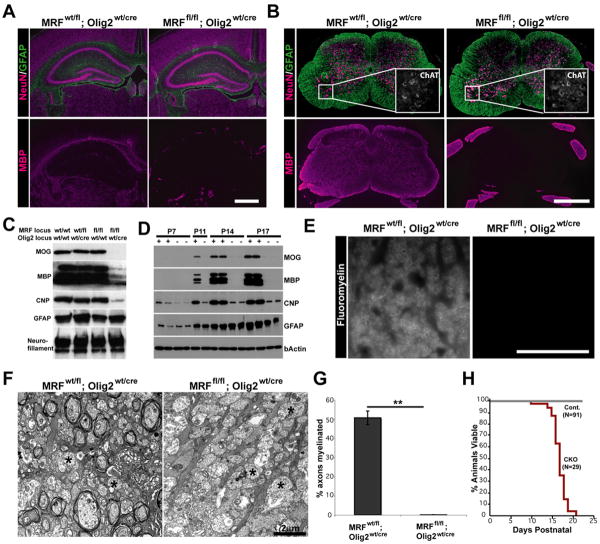
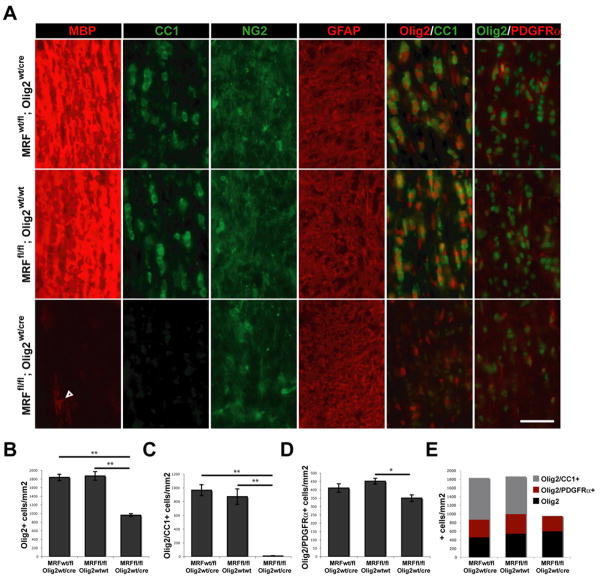
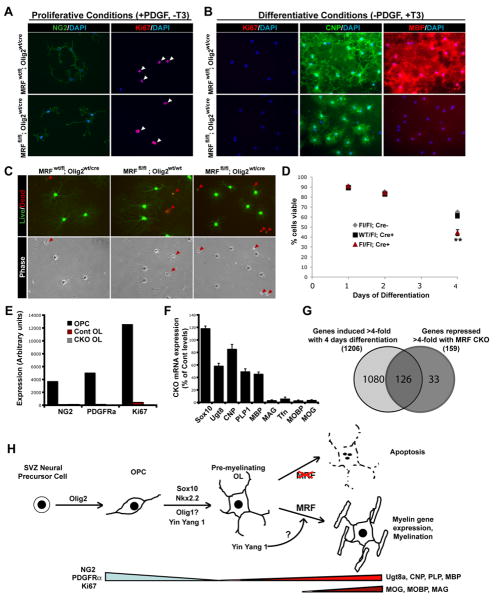
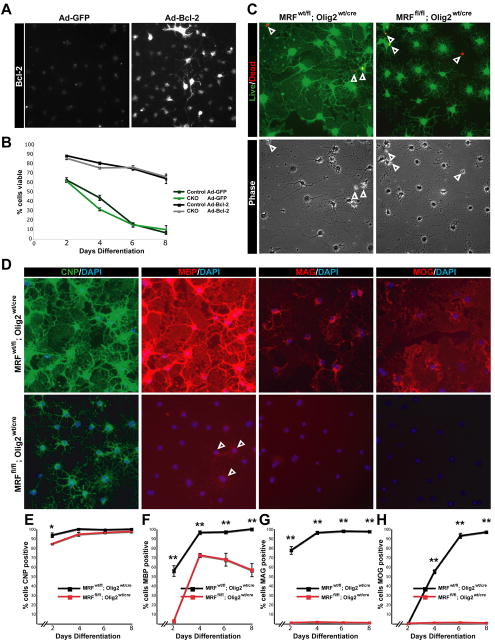
The transcriptional control of CNS myelin gene expression is poorly understood. Here we identify gene model 98, which we have named myelin gene regulatory factor (MRF), as a transcriptional regulator required for CNS myelination. Within the CNS, MRF is specifically expressed by postmitotic oligodendrocytes. MRF is a nuclear protein containing an evolutionarily conserved DNA binding domain homologous to a yeast transcription factor. Knockdown of MRF in oligodendrocytes by RNA interference prevents expression of most CNS myelin genes; conversely, overexpression of MRF within cultured oligodendrocyte progenitors or the chick spinal cord promotes expression of myelin genes. In mice lacking MRF within the oligodendrocyte lineage, premyelinating oligodendrocytes are generated but display severe deficits in myelin gene expression and fail to myelinate. These mice display severe neurological abnormalities and die because of seizures during the third postnatal week. These findings establish MRF as a critical transcriptional regulator essential for oligodendrocyte maturation and CNS myelination.


Figures

Figure 1
Figure 1. GM98/MRF is a nuclear protein specifically expressed within the CNS by postmitotic OLS
(A) Affymetrix expression levels of GM98/MRF in acutely isolated cells from the mouse CNS (probe set 1439506_at). Expression was considered present by GCOS software for the OPC, GalC+ OL and MOG+ OL samples. (B) Northern blot confirmed expression of MRF as a single ∼5.5Kb transcript within P20 brain and cultured OLs, but not heart tissue, similar to OL marker CNP. GAPDH controls for mRNA loading. (C) In situ hybridization for PLP and MRF expression within the lateral corpus callosum (cc) and scattered cells in the overlying cortex. Scale bar=100μm (D) Schematic of the protein domains of GM98/MRF and the human orthologue C11Orf9, showing percent identity in each region. (E) Subcellular localization of myc-tagged MRF within HEK cells. Staining of Myc-MRF-transfected HEK cells with anti-myc indicates a predominantly nuclear localization of the protein, with co-localization with the nuclear counterstain DAPI in transfected cells. Non myc-tagged MRF and a myc-tagged protein displaying a cytoplasmic localization provide a negative control for the staining and a comparison, respectively. Scale bar=50um. (F) In situ hybridization for MRF and PLP in P3-21 sagittal brain sections showing their developmental expression profile. (G) Double fluorescent in situ hybridization for MRF and PLP in the white matter of the developing cerebellum (P3-21); arrowheads indicate MRF+/PLP- cells.
Figure 2
Figure 2. Knockdown of MRF in OLs blocks myelin gene expression
(A-B) Representative images of OL cultures transfected with siCont or siMRF and differentiated for 1, 2 and 4 days stained with NG2 and MBP (A) or MOG (B). Scale bars=50um. (C-D) Quantification of the proportion of siCont and siMRF transfected OLs expressing MBP (C) and MOG (D) at 1, 2 and 4 days differentiation. **P<0.01. (E) Northern blot analysis of gene expression in siCont and siMRF transfected OL cultures at 2 days differentiation. RNA from brain, heart and cultured astrocyte samples are provided for positive and negative controls, respectively. (F-G) Results of GeneChip analysis of gene expression in OPCs and OLs transfected with siCont or siMRF as OPCs then cultured for 2 days in differentiating conditions. (F) Down-regulation of selected OPC markers NG2, PDGFRα and Ki67 during differentiation is not affected by MRF knockdown. (G) Expression of OL pan-OL lineage marker Sox10, early-OL markers (Ugt8, CNP, PLP and MBP) and late-OL markers (MAG, transferrin/Tfn, MOBP and MOG) in cells transfected with siMRF expressed as a mean percentage of siCont transfected OL values ±SEM. Results are averages of 3 independent experiments. (H) Venn diagram showing overlap of genes induced >4-fold with differentiation and those repressed >4-fold by transfection with siMRF.
Figure 3
Figure 3. Forced MRF expression induces myelin gene expression in vitro and in vivo
(A) Representative images of mouse OPCs co-transfected with eGFP and control (empty) vector, or vectors encoding MRF or Sox10 and then cultured for 2 days post transfection in proliferative conditions. Cells are stained for the OPC marker NG2 or OL markers MBP and MOG. Scale bar=50um. (B-C) Quantification of the proportion of transfected cells in each condition expressing MBP (B) and MOG (C) at 2 and 5 days post transfection. **P<0.01, unpaired t-test. Values are means± SEM. (D) Representative spinal cord sections of chicken embryos electroporated with expression constructs for MRF, Sox10 or both genes at E3 (stage 12) along with a GFP construct and allowed to develop until E7. Sections are stained with anti-MBP, with GFP shown to identify electroporated cells. (E) Quantification of the proportion of electroporated cells expressing MBP for each condition; shown are values for individual animals and median values for each condition (red bars). (F-G) Examples of MRF-electroporated neural crest cells ectopically expressing MBP (F); (G) shows triple labeling for GFP, MBP and Sox10. The arrowhead indicates a triple-labeled cell, a GFP/Sox10+, MBP- cell can be seen to the left of the image.
Figure 4
Figure 4. MRF CKOs display CNS dysmyelination
(A-B) Representative images of the hippocampus, corpus callosum and overlying cortex (A) and spinal cord (B) of control (MRFwt/fl; Olig2wt/Cre) and MRF CKO (MRFfl/fl; Olig2wt/Cre) mice stained with MBP, NeuN and GFAP at P13. ChAT staining of spinal cord motor neurons is shown in the inserts of (B). (C) Western blot analysis of CNP, MBP, MOG, GFAP and Neurofillament expression in the spinal cords of MRF control and CKO mice at P13. (D) Developmental time-course of myelin gene expression in the brains of MRF control (+) and CKO (-) mice with CKOs showing severe deficit in MBP and MOG expression. (E) Representative images of Fluoromyelin staining of the spinal cord lateral column white matter in a control (MRFwt/fl; Olig2wt/Cre) and CKO (MRFfl/fl; Olig2wt/cre) mouse at P13. (F) Representative electron micrograph images of control and CKO optic nerves at P13. Control nerves show a significant amount of myelination in progress. In contrast, essentially all axons in the CKOs lack myelin ensheathment (examples denoted by *). Proportions of axons myelinated for control and CKOs are quantified in (G). (H) The lifespan of MRF CKOs is essentially limited to the third postnatal week. Scale bars: A and B=1mm. E=50um. E=2um. **P<0.01
Figure 5
Figure 5. MRF CKOs display a loss of mature OLs
(A) Immunostaining for MBP, CC1, NG2, GFAP and Olig2 co-stained with CC1 and PDGFRα within the optic nerves of control (MRFwt/fl; Olig2wt/cre and MRFfl/fl; Olig2wt/wt) and MRF CKO (MRFfl/fl; Olig2wt/cre) mice at P13. Scale bar=50um. (B) Quantification of the density of Olig2 immunopositive nuclei within the optic nerves. (C) Quantification of the density of Olig2+/CC1+ double-immunopositive OLs within the optic nerves. (D) Quantification of the density of Olig2+/PDGFRα+ double-immunopositive OPCs within the optic nerves. All results are expressed as means ±SEM, n=4-5 per genotype. *P<0.05, **P<0.01. (E) Densities of Olig2 immunopositive cells within the optic nerves of each genotype broken down into Olig2+ cells also positive for either CC1 (OLs), PDGFRα (OPCs) or neither marker.
Figure 6
Figure 6. MRF deficient OPC/OL cultures display deficiencies in differentiative, but not proliferative, conditions
(A-B) Immunostaining of control (MRFwt/fl; Olig2wt/cre) and CKO (MRFfl/fl; Olig2wt/cre) cultures for NG2 and Ki67 in proliferative (A) or differentiative (B) conditions. Arrowheads indicate Ki67+ nuclei. The same cells stained for CNP and MBP are shown in (B). Scale bars=100um. (C) Representative images of control and CKO cells stained with calcein AM (green; live cells) and ethidium homodimer (red; dead cells) at 4 days differentiation showing decreased viability and altered morphology of CKO cells. (D) Quantification of viability of control and CKO cells at 1 to 4 days differentiation. (E) Affymetrix expression levels of selected OPC markers NG2, PDGFRα and Ki67 for control and CKO cells at 4 days differentiation; CKO cells display normal down-regulation of these markers. (F) Expression levels of selected oligodendrocyte lineage markers in CKO cells at 4 days differentiation relative to control cells (G) Venn diagram showing overlap of genes induced >4-fold with OL differentiation and those repressed >4-fold in CKO relative to control cells. (H) Schematic of transcriptional control of OL lineage specification and differentiation. MRF is required for the maturation of pre-myelinating OLs into mature OLs expressing the full complement of myelin genes, with its induction possibly regulated by YY1.
Figure 7
Figure 7. Blocking apoptosis does not restore myelin gene expression in MRF CKO oligodendrocytes
(A) Confirmation of Bcl-2 overexpression in Ad-BCL-2 infected cells. (B) Viability of control and CKO cells infected with Ad-GFP or Ad-Bcl-2 over 8 days in differentiation media. (C) Calcien-AM/ethidium homodimer and phase images of Ad-Bcl-2 infected control and CKO cells at 6 days differentiation showing viability and morphology. Arrowheads indicate dead cells. (D) Expression of CNP, MBP, MAG and MOG in Ad-Bcl-2 infected control and CKO cells at 6 days differentiation. Arrowheads indicate faintly MBP+ CKO cells. (E-H) Quantification of the proportion of Ad-Bcl-2 infected control and CKO cells positive for CNP, MBP, MAG and MOG from 2-8 days differentiation. *P<0.05 **P<0.01

References

    1. Arnett HA, Fancy SP, Alberta JA, Zhao C, Plant SR, Kaing S, Raine CS, Rowitch DH, Franklin RJ, Stiles CD. bHLH transcription factor Olig1 is required to repair demyelinated lesions in the CNS. Science. 2004;306:2111–2115. - PubMed
    1. Barres BA, Hart IK, Coles HS, Burne JF, Voyvodic JT, Richardson WD, Raff MC. Cell death and control of cell survival in the oligodendrocyte lineage. Cell. 1992;70:31–46. - PubMed
    1. Cahoy JD, Emery B, Kaushal A, Foo LC, Zamanian JL, Christopherson KS, Xing Y, Lubischer JL, Krieg PA, Krupenko SA, et al. A transcriptome database for astrocytes, neurons, and oligodendrocytes: a new resource for understanding brain development and function. J Neurosci. 2008;28:264–278. - PMC - PubMed
    1. Dugas JC, Tai YC, Speed TP, Ngai J, Barres BA. Functional genomic analysis of oligodendrocyte differentiation. J Neurosci. 2006;26:10967–10983. - PMC - PubMed
    1. Farley FW, Soriano P, Steffen LS, Dymecki SM. Widespread recombinase expression using FLPeR (flipper) mice. Genesis. 2000;28:106–110. - PubMed

Publication types

Substances

Associated data