. 2009 Oct;8(10):2285-95.
doi: 10.1074/mcp.M800514-MCP200. Epub 2009 Jul 12.

Development and evaluation of normalization methods for label-free relative quantification of endogenous peptides

Affiliations

Development and evaluation of normalization methods for label-free relative quantification of endogenous peptides

Kim Kultima et al. Mol Cell Proteomics. 2009 Oct.

Abstract

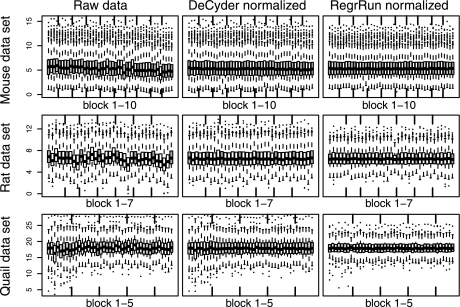
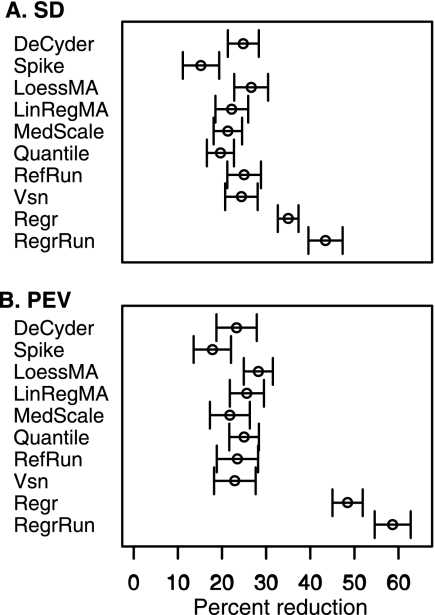
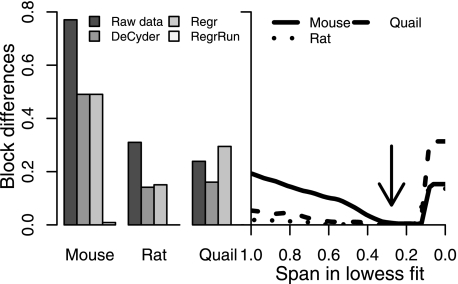
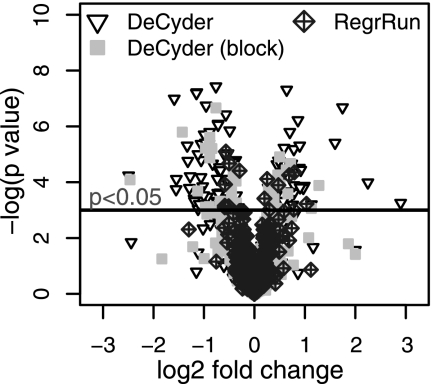
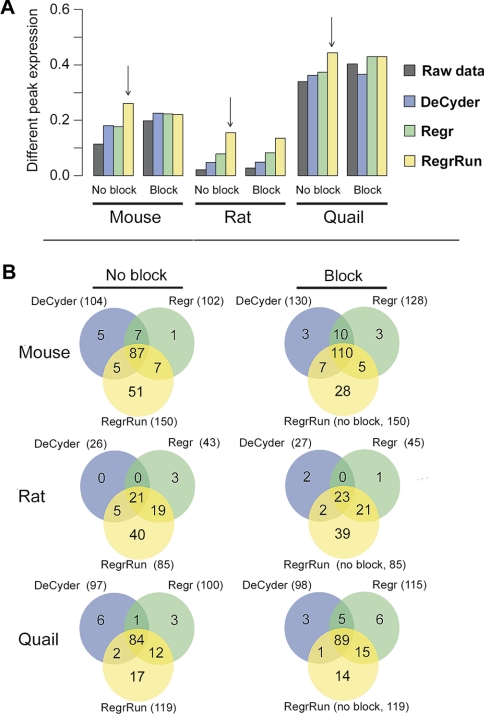
The performances of 10 different normalization methods on data of endogenous brain peptides produced with label-free nano-LC-MS were evaluated. Data sets originating from three different species (mouse, rat, and Japanese quail), each consisting of 35-45 individual LC-MS analyses, were used in the study. Each sample set contained both technical and biological replicates, and the LC-MS analyses were performed in a randomized block fashion. Peptides in all three data sets were found to display LC-MS analysis order-dependent bias. Global normalization methods will only to some extent correct this type of bias. Only the novel normalization procedure RegrRun (linear regression followed by analysis order normalization) corrected for this type of bias. The RegrRun procedure performed the best of the normalization methods tested and decreased the median S.D. by 43% on average compared with raw data. This method also produced the smallest fraction of peptides with interblock differences while producing the largest fraction of differentially expressed peaks between treatment groups in all three data sets. Linear regression normalization (Regr) performed second best and decreased median S.D. by 38% on average compared with raw data. All other examined methods reduced median S.D. by 20-30% on average compared with raw data.


Figures

Fig. 1.
Fig. 1.
The fraction of successfully matched peaks across LC-MS analyses. Open spots are different biological samples, and gray spots are technical replicates. In the Mouse data set there was a weak trend of lower peak matching success at the end of the experiment, whereas the opposite was found in the Quail data set. Analyses with overall lower matching success were often accompanied with overall low intensity values, resulting in lack of detection of lowly expressed peaks in these analyses.
Fig. 2.
Fig. 2.
Box plots of the log2 intensity values (y axis) for the individual LC-MS analyses in each data set before and after normalization using the DeCyder and RegrRun methods. The data are displayed in the analysis order of the samples. Open boxes are different biological samples, and gray box plots are technical replicates. Both normalization methods successfully assured that the intensity values have approximately the same average and empirical distribution across all analyses for each data set. The box plots display the median, first and third quartiles. The whiskers extend to the extreme values or at most 1.5 times the interquartile range from the box. Observations outside the whiskers are plotted as dots.
Fig. 3.
Fig. 3.
Box plots of the regression coefficient between technical replicates for raw, DeCyder-, and RegrRun-normalized data. For the RegrRun normalized data the regression coefficient was close to 1 in all three data sets. The box plots display the median, first and third quartiles. The whiskers extend to the extreme values or at most 1.5 times the interquartile range from the box. Observations outside the whiskers are plotted as open circles.
Fig. 4.
Fig. 4.
The average median S.D. and PEV reduction after applying different normalization methods compared with raw data. The largest reductions were observed with the methods Regr and RegrRun, and the smallest reduction was observed with the Spike method. Intermediate reductions were observed with the remaining seven methods. The error bars display 1 standard error of the mean.
Fig. 5.
Fig. 5.
The fractions of peaks with statistically significant (p < 0.05) interblock differences using raw, DeCyder-, and Regr-normalized data in the three data sets (left panel) are shown. The fractions decreased (Mouse and Rat) after normalizing the data using the DeCyder and Regr methods. Using the RegrRun method with default Lowess span setting (0.3; indicated by the arrow) resulted, in principle, in no peaks displaying significant interblock differences (left and right panels). Span settings <0.15 resulted in increased interblock differences due to overfitting.
Fig. 6.
Fig. 6.
Volcano plot displaying the log2 -fold change and −log (p value) between the first five pool replicates compared with the last five replicates in the Mouse data set. For DeCyder-normalized data, 19.5% of all peaks were statistically significantly different (p < 0.05) between the two groups. Both the fraction and the magnitude of log2 -fold change decreased when including the block term in the linear model. For RegrRun-normalized data only 2.6% of the peaks were statistically significantly different, and the log2 -fold changes were much smaller compared with the DeCyder-normalized data.
Fig. 7.
Fig. 7.
The number of differentially expressed peaks in the Mouse, Rat, and Quail data sets using the RegrRun method compared with raw, DeCyder-, and Regr-normalized data (p < 0.05). The largest fraction of differentially expressed peaks was found in the RegrRun-normalized data (panel A, vertical arrows). For raw, DeCyder-, and Regr-normalized data the numbers of differentially expressed peaks were calculated both with and without including the block term in the linear model. The largest number of overlapping peaks compared with the RegrRun method was found when including the block term for raw, DeCyder-, and Regr-normalized data (panel B).

References

    1. Clynen E., Baggerman G., Veelaert D., Cerstiaens A., Van der Horst D., Harthoorn L., Derua R., Waelkens E., De Loof A., Schoofs L. (2001) Peptidomics of the pars intercerebralis-corpus cardiacum complex of the migratory locust, Locusta migratoria. Eur. J. Biochem 268, 1929–1939 - PubMed
    1. Schulz-Knappe P., Zucht H. D., Heine G., Jürgens M., Hess R., Schrader M. (2001) Peptidomics: the comprehensive analysis of peptides in complex biological mixtures. Comb. Chem. High Throughput Screen 4, 207–217 - PubMed
    1. Verhaert P., Uttenweiler-Joseph S., de Vries M., Loboda A., Ens W., Standing K. G. (2001) Matrix-assisted laser desorption/ionization quadrupole time-of-flight mass spectrometry: an elegant tool for peptidomics. Proteomics 1, 118–131 - PubMed
    1. Svensson M., Sköld K., Nilsson A., Fälth M., Nydahl K., Svenningsson P., Andrén P. E. (2007) Neuropeptidomics: MS applied to the discovery of novel peptides from the brain. Anal. Chem 79, 15–16, 18–21 - PubMed
    1. Svensson M., Sköld K., Nilsson A., Fälth M., Svenningsson P., Andrén P. E. (2007) Neuropeptidomics: expanding proteomics downwards. Biochem. Soc. Trans 35, 588–593 - PubMed

Publication types

LinkOut - more resources