. 2010 Feb;20(2):365-82.
doi: 10.1093/cercor/bhp107. Epub 2009 Jul 13.

Duration of coherence intervals in electrical brain activity in perceptual organization

Affiliations

Duration of coherence intervals in electrical brain activity in perceptual organization

Andrey R Nikolaev et al. Cereb Cortex. 2010 Feb.

Abstract

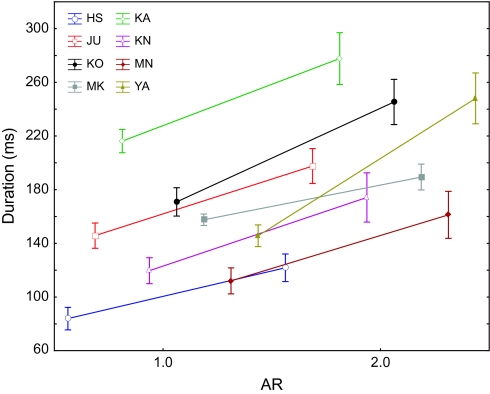
We investigated the relationship between visual experience and temporal intervals of synchronized brain activity. Using high-density scalp electroencephalography, we examined how synchronized activity depends on visual stimulus information and on individual observer sensitivity. In a perceptual grouping task, we varied the ambiguity of visual stimuli and estimated observer sensitivity to this variation. We found that durations of synchronized activity in the beta frequency band were associated with both stimulus ambiguity and sensitivity: the lower the stimulus ambiguity and the higher individual observer sensitivity the longer were the episodes of synchronized activity. Durations of synchronized activity intervals followed an extreme value distribution, indicating that they were limited by the slowest mechanism among the multiple neural mechanisms engaged in the perceptual task. Because the degree of stimulus ambiguity is (inversely) related to the amount of stimulus information, the durations of synchronous episodes reflect the amount of stimulus information processed in the task. We therefore interpreted our results as evidence that the alternating episodes of desynchronized and synchronized electrical brain activity reflect, respectively, the processing of information within local regions and the transfer of information across regions.


Figures

Figure 1.
Figure 1.
Stimuli used in Experiments 1 and 2. (A) Grouping of dots in a lattice depends on its “ARs”: the ratio of the shortest and longest distances between the dots. (B) Dot lattices of ARs 1.0 and 2.0 used in Experiment 1. (C) Dot lattices of ARs 1.0, 1.1, 1.2, 1.3 used in Experiment 2.
Figure 2.
Figure 2.
A 256-channel electrical Geodesic Sensor Net with individually selected chains of adjacent electrodes for synchronization analysis. (A) Electrode chains for 9 participants in Experiment 1. The chains in the peak areas are marked by blue (solid) lines, and those in the “opposite” areas are marked by red (dashed) lines. The green (dotted) lines designate chains in the right and left temporoparietal (control) areas. (B) The chains in the peak areas for 13 participants in Experiment 2. Spacing between electrodes is uniform, which is distorted in the figure because of the polar projection. The labels of landmark electrodes are according to the International 10-20 system of electrode placement. The inset in the right upper corner illustrates how an electrode chain was selected in the peak area on the voltage map at the peak latency of the P1 component.
Figure 3.
Figure 3.
(A) Definition and duration estimation of a synchronized interval. On a single trial, 4 pairwise synchronization indices are measured as a function of time in a chain of 5 electrodes (shown schematically on the top). SD across the synchronization indices are computed as a function of time. The synchronized interval is a period during which SD falls below a threshold in the range of thresholds shaded in the figure. (B) Example of 1 run of search for differences between conditions at a given SD threshold: the results of 15 sequential t-tests with sequential removing of intervals shorter than the values of durations on the abscissa. Significant t values summed to obtain a t-sum statistic are marked with asterisks. The duration with a maximal behavioral difference is marked “max.”
Figure 4.
Figure 4.
Grouping sensitivity in Experiment 2. In every panel, we plot the log-odds of responses as a function of lattice ARs. The thick lines represent linear fits to the data. The slopes of fits (attraction coefficients indicated in the top right corner of each panel) represent grouping sensitivity. In (A), we plot results for participants whose synchronized intervals were systematically related to AR, and in (B), we plot results for participants who showed no such relation.
Figure 5.
Figure 5.
Percentage of participants with longer (AR1.0>) and shorter (AR1.0<) durations in condition AR = 1.0 than in AR > 1.0, for 4 areas in Experiment 1 and for 2 areas in Experiment 2. Data for different frequency bands appear in separate panels: alpha in (A), beta in (B), and gamma in (C). The blue (solid) and red (dashed) horizontal lines represent 95% significance levels computed in the permutation procedures, respectively, in Experiments 1 and 2. The absolute number of participants corresponding to the significance levels in both experiments is 7. The asterisks mark the conditions that exceeded the significance level.
Figure 6.
Figure 6.
Distributions of frequencies (A), SD thresholds (B), and minimum durations (C) of synchronized intervals corresponding to maximal difference between conditions AR = 1.0 and AR > 1.0 in the 2 experiments.
Figure 7.
Figure 7.
Mean and SEM for durations of synchronized intervals for each participant in the peak areas in Experiment 1.
Figure 8.
Figure 8.
(A) Mean and SEM for durations of synchronized intervals in the peak and opposite areas in Experiment 2 for the participants in whom we found shorter durations in AR = 1.0 than in AR > 1.0. The line in every panel represents a linear regression fit to the data. The regression coefficients of the slopes are plotted, respectively, in (B) and (C).
Figure 9.
Figure 9.
Mean, SEM, and the range of durations of synchronized intervals averaged across 8 participants in whom we found shorter durations in AR = 1.0 than in AR > 1.0 in the 2 experiments.
Figure 10.
Figure 10.
(A) Grand-average amplitude of phase-locked beta activity for the 4 ARs. (B) Grand-average intertrial coherence for the 4 ARs. (C) Grand-average amplitude of nonphase-locked beta activity for the 4 ARs. The horizontal bars indicate intervals of significant AR effects: according to pointwise ANOVAs (black) and according to pointwise regressions (gray). (D) Mean and SEM of the phase-locked amplitude in the interval of 230–254 ms after stimulus, shown in (A). (E) Mean and SEM of the intertrial coherence in the interval of 0–200 ms after stimulus. (F, G) Mean and SEM of the nonphase-locked amplitude in the intervals from 70 to 18 ms before stimulus onset and 22–64 ms after stimulus onset, shown in (C).
Figure 11.
Figure 11.
(A, C) Duration distributions of the synchronized intervals (pooled over participants) that were longer than the MD in Experiment 1 (A) and Experiment 2 (B). The red curve is the fit of the generalized extreme value distribution. (B, D) The Kolmogorov–Smirnov (KS) statistic and the corresponding P levels for 38 distributions in Experiment 1 (C) and Experiment 2 (D). The vertical line designates 0.05 significant P level.
Figure 12.
Figure 12.
Frequencies of the onsets and offsets (mean ± SEM) of synchronized intervals that were longer or shorter than the minimum duration for Experiment 1 (A) and Experiment 2 (B). Significant changes of frequency relative to neighboring bins are marked by asterisks.
Figure 13.
Figure 13.
Correlation between attraction coefficients (which measure grouping sensitivity; Fig. 4) and durations of synchronized intervals (mean ± SEM) for each AR condition in the group of 8 participants in Experiment 2.

References

    1. Arieli A, Sterkin A, Grinvald A, Aertsen A. Dynamics of ongoing activity: explanation of the large variability in evoked cortical responses. Science. 1996;273:1868–1871. - PubMed
    1. Barrie JM, Freeman WJ, Lenhart MD. Spatiotemporal analysis of prepyriform, visual, auditory, and somesthetic surface EEGs in trained rabbits. J Neurophysiol. 1996;76:520–539. - PubMed
    1. Barry RJ, Kirkaikul S, Hodder D. EEG alpha activity and the ERP to target stimuli in an auditory oddball paradigm. Int J Psychophysiol. 2000;39:39–50. - PubMed
    1. Basar E. Dynamics of potentials from invertebrate brain. In: Basar E, editor. Brain functions and oscillations II: Integrative brain function. Neurophysiology and cognitive processes. Berlin: Springer; 1999. pp. 91–108.
    1. Brandt ME, Jansen BH, Carbonari JP. Pre-stimulus spectral EEG patterns and the visual evoked response. Electroencephalogr Clin Neurophysiol. 1991;80:16–20. - PubMed

MeSH terms