. 2009 Sep;29(18):5031-45.
doi: 10.1128/MCB.00144-09. Epub 2009 Jul 13.

The tumor suppressor functions of p27(kip1) include control of the mesenchymal/amoeboid transition

Affiliations

The tumor suppressor functions of p27(kip1) include control of the mesenchymal/amoeboid transition

Stefania Berton et al. Mol Cell Biol. 2009 Sep.

Abstract

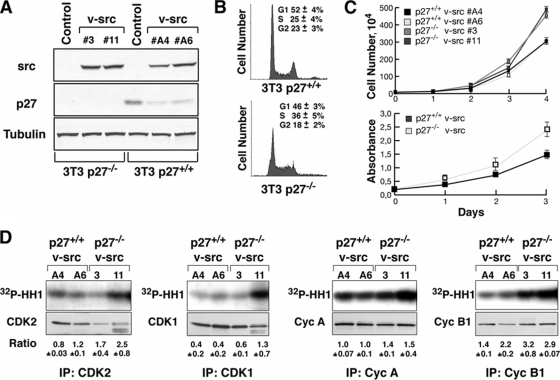
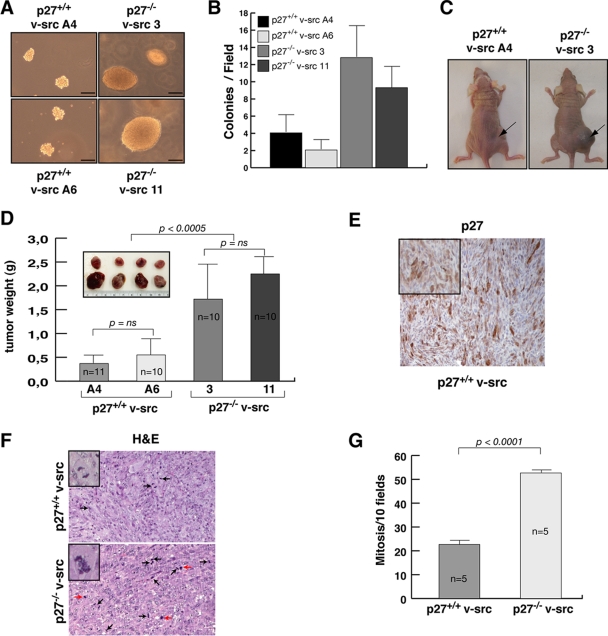
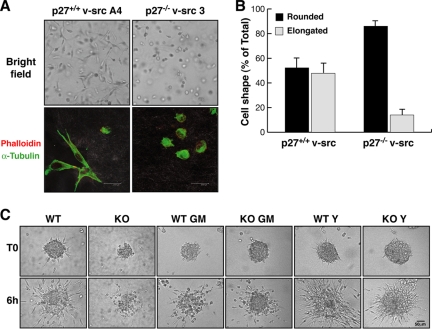
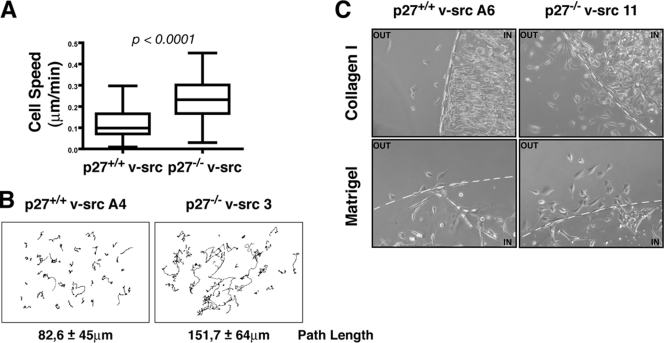
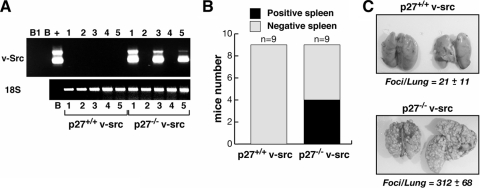
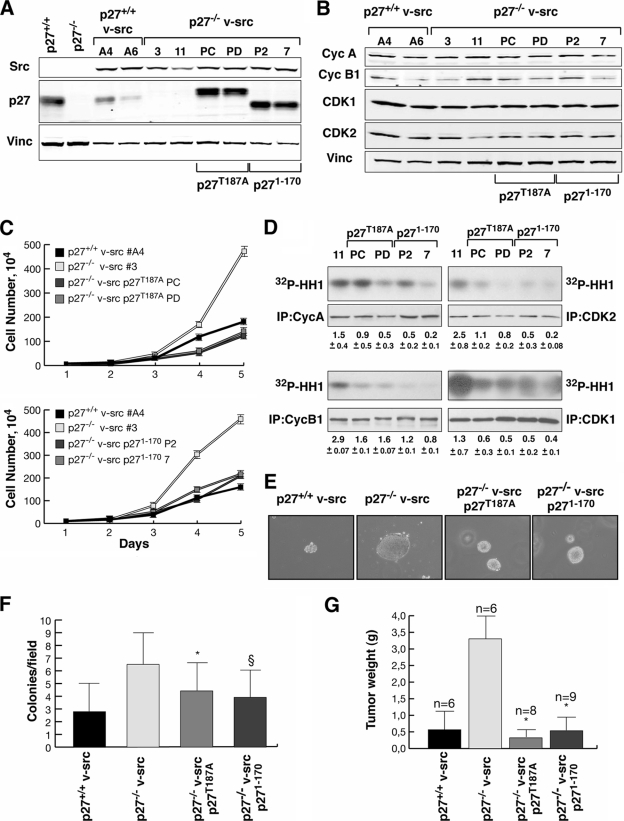
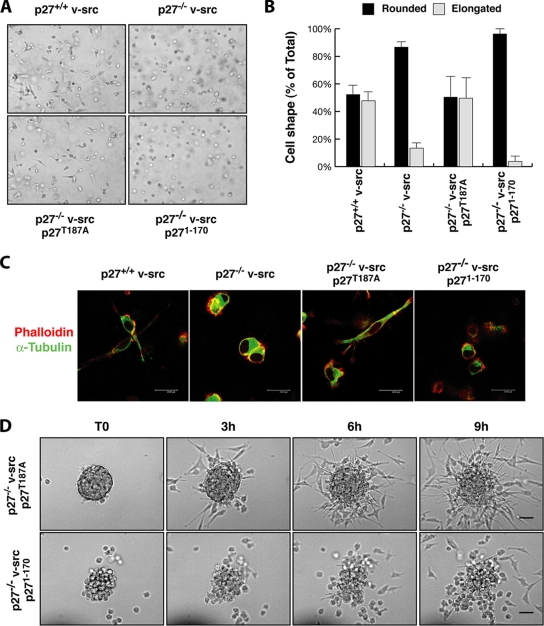
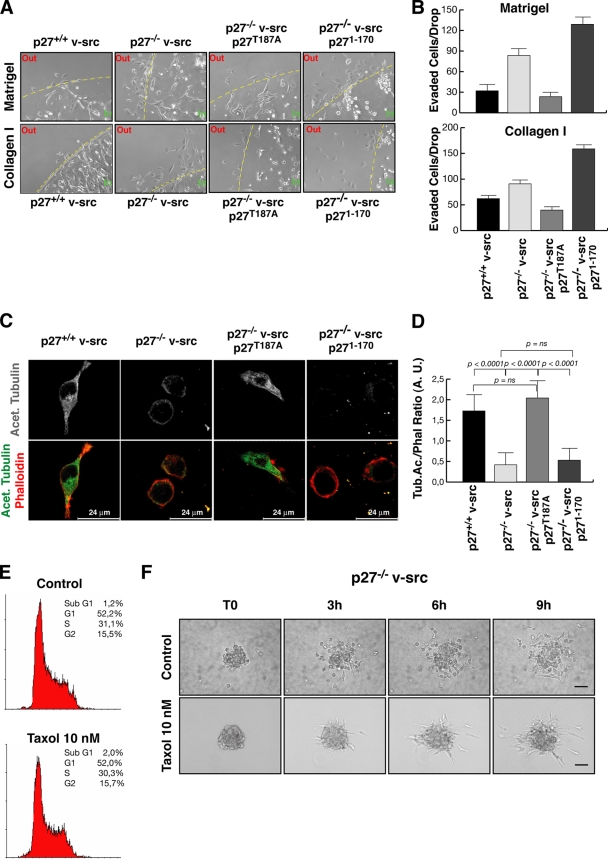
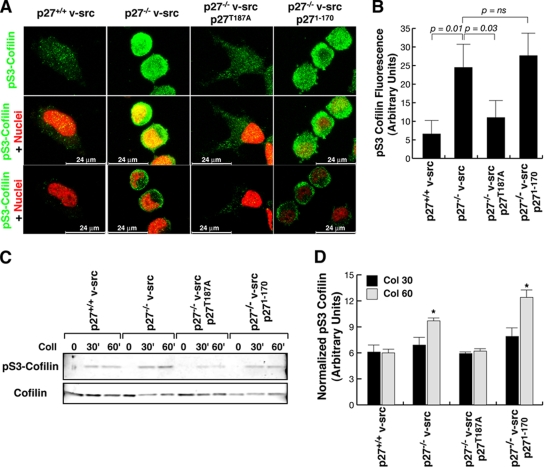
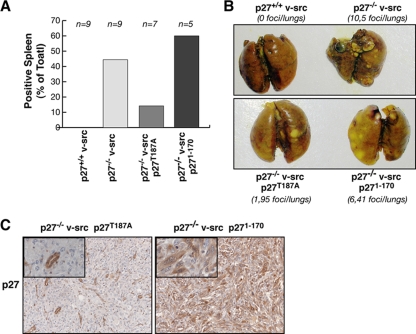
In many human cancers, p27 downregulation correlates with a worse prognosis, suggesting that p27 levels could represent an important determinant in cell transformation and cancer development. Using a mouse model system based on v-src-induced transformation, we show here that p27 absence is always linked to a more aggressive phenotype. When cultured in three-dimensional contexts, v-src-transformed p27-null fibroblasts undergo a morphological switch from an elongated to a rounded cell shape, accompanied by amoeboid-like morphology and motility. Importantly, the acquisition of the amoeboid motility is associated with a greater ability to move and colonize distant sites in vivo. The reintroduction of different p27 mutants in v-src-transformed p27-null cells demonstrates that the control of cell proliferation and motility represents two distinct functions of p27, both necessary for it to fully act as a tumor suppressor. Thus, we highlight here a new p27 function in driving cell plasticity that is associated with its C-terminal portion and does not depend on the control of cyclin-dependent kinase activity.


Figures

FIG. 1.
FIG. 1.
The absence of p27 in v-src-transformed cells provides a proliferative advantage in vitro. (A) Western blot analysis of v-src and p27 expression in p27+/+ and p27−/− v-src-clones. α-Tubulin was used to normalize the amount of loaded proteins. (B) Cell cycle distribution of exponentially growing p27+/+ and p27−/− v-src cells evaluated by FACS analysis. The percentage of cells in each phase of the cell cycle is reported in the graph and represents the mean (± standard deviation) from three independent experiments. (C) Growth curve analysis (upper graph) and MTT assay (lower graph) of p27+/+ and p27−/− v-src cells. Data represent the means and standard deviations from three independent experiments performed in triplicate (growth curve) or six times (MTT assay) (P = 0.001 for growth curve and P = 0.0001 for MTT assay at day 4 using Student's t test). (D) Kinase activity associated with CDK2, CDK1, cyclin A, and cyclin B1, using histone H1 as the substrate. In the lower panels the amount of immunoprecipitated (IP) protein is shown. The normalized kinase activities (expressed in arbitrary units) reported under each lane represent the means (± standard deviations) from three independent experiments.
FIG. 2.
FIG. 2.
Absence of p27 in v-src-transformed cells provides a growth advantage in vivo. (A and B) Soft-agar assay of v-src-transformed cells. In panel A, representative pictures of colonies after 8 days of incubation in agar are shown. Bar, 50 μm. In panel B, the quantification representing the means and standard deviations from three independent experiments each performed in triplicate is reported. For each cell line at least 15 randomly selected fields (10× objective) were counted (P < 0.001 for p27+/+ versus p27−/− by Student's t test). (C) Typical images of tumors in nude mice injected with 1 × 10⁶ p27+/+ (left) and p27−/− (right) v-src cells. (D) A representative picture of tumors explanted 15 days after injection and quantification of tumor mass, representing the mean values and standard deviations for 11 mice for p27+/+ v-src A4, 10 mice for p27+/+ v-src A6, and 10 mice for p27−/− v-src 3 and 11. (E) Representative image of p27 expression in tumors formed by p27+/+ v-src cells. A nucleocytoplasmic expression of p27 is clearly visible in the inset at higher magnification. (F) Representative images of hematoxylin-eosin staining performed on explanted xenografts, as indicated. Black arrows indicate normal mitoses. Red arrows indicate atypical mitoses. The insets show higher magnification of a normal mitosis in p27+/+ v-src tumors (upper panel) and of an atypical mitosis in p27−/− v-src tumors (lower panel). (G) Quantification of mitotic figures obtained by analyzing 10 consecutive high-power fields in five tumors for each genotype. Error bars indicate standard deviations.
FIG. 3.
FIG. 3.
p27−/− v-src cells assume a rounded morphology and preferentially use amoeboid-like motility in a 3D environment. (A) Representative pictures of p27+/+ and p27−/− transformed fibroblasts after 10 h of inclusion in 3D collagen I. In the upper panels, typical bright-field images acquired using a 10× objective are shown. In the lower panels, confocal images of the cells stained for F-actin with phalloidin-AlexaFluor546 (pseudocolored in red) and for MTs with antitubulin-FITC (pseudocolored in green) are shown. In gray, the collagen fibers acquired using the reflection parameter are represented. Bar, 24 μm. (B) Quantification of the cellular shape assumed by p27+/+ and p27−/− transformed fibroblasts included in 3D collagen I. Cells were classified as rounded or elongated. The results represent the means and standard deviations from three independent experiments in which five randomly selected fields were counted. (C) Cell spheroids were included in a 3D collagen matrix and treated with the metalloproteinase inhibitor GM6001 (10 μM) or with the ROCK inhibitor Y27632 (10 μM). Complete medium was used as a control. Spheroids were evaluated by bright-field microscopy, collecting one picture every 4 min for at least 12 h. The photograms collected after 0 and 6 h of incubation at 37°C in a typical experiment are reported. Bar, 50 μm.
FIG. 4.
FIG. 4.
p27−/− v-src cells included in 3D matrices display increased motility. (A) Single-cell speed of p27+/+ and p27−/− v-src fibroblasts included in 3D collagen I, calculated using time-lapse video microscopy coupled with semiautomatic cell tracking. Data represent the means from three independent experiments in which 40 cells for each cell line were tracked (P < 0,0001; Mann-Whitney U test). In the box plots the median value (line within the box), the interquartile range representing 50% of the data (boundaries of the box), and the spread (vertical lines) representing the highest and lowest value (horizontal lines) are shown. (B) Orthotopically projected cell paths of p27+/+ and p27−/− v-src fibroblasts in 3D collagen I. The mean (± standard deviation) path length from three independent experiments is reported (P < 10−12 by Student's t test). (C) Evasion assay of p27+/+ and p27−/− v-src-transformed fibroblasts in collagen I or Matrigel drops (as indicated). Pictures show cells that exited from the matrix drops 24 h after the inclusion. The dashed line indicates the drop edge.
FIG. 5.
FIG. 5.
p27−/− v-src cells display increased intravasation and extravasation abilities in vivo. (A and B) RT-PCR on RNA extracts from mouse spleens, using specific primers to identify transformed cells. Mice were injected subcutaneously with v-src cell clones (n = 9 for genotype) and analyzed for the presence of tumor cells in the spleen. The ribosomal 18S subunit was used as a control for RNA integrity and amount. The cDNA derived from one primary tumor was used as positive control (+). B and B1 indicate the negative control and the blank. (B) Numbers of positive and negative spleens. (C) Representative picture of lungs explanted from mice injected in the tail veins with v-src-transformed fibroblasts 1 month after the injection. The means (± standard deviations) of the number of macroscopic lesions per lung in four animals per genotype are also reported.
FIG. 6.
FIG. 6.
Reexpression of p27 in p27−/− v-src cells reduces their in vitro and in vivo growth. (A) Western blot analysis of v-src and p27 expression in the indicated cell clones. Vinculin was used to normalize the amount of proteins present in each lane. (B) Western blot analysis of cyclin A, cyclin B1, CDK1, CDK2, and vinculin expression in exponentially growing cells. (C) Growth curve analysis of p27−/− v-src p27T187A (upper graph) and p271-170 (lower graph) fibroblasts. Data represent the means and standard deviations from three independent experiments performed in duplicate, in which the cells were counted each day for 5 days (P = 0.001 for p27−/− v-src versus p27T187A and p271-170 at day 5 using Student's t test). (D) Cyclin A-, cyclin B1-, CDK1-, and CDK2-associated kinase activity, using histone H1 (32P-HH1) as a substrate (upper panels). In the lower panels the amount of immunoprecipitated (IP) protein is shown. The normalized kinase activities (expressed in arbitrary units) reported under each lane represent the means (± standard deviations) from three independent experiments. (E and F) Soft-agar assay of the indicated v-src-transformed cells. In panel E, representative pictures of colonies after 8 days of incubation in agar are shown. In panel F, the number of colonies per field is reported, representing the means and standard deviations from three independent experiments each performed in triplicate (*, P = 0.007; §, P < 0.0001 [versus p27−/− v-src cells, using Student's t test]). (G) Quantification of tumor masses explanted from mice subcutaneously injected with the indicated cells. Values represent the means and standard deviations for six mice injected with p27+/+ v-src cells, six mice injected with p27−/− v-src cells, eight mice injected with p27T187A v-src cells, and nine mice injected with p271-170 v-src cells(*, P < 10−5 versus p27−/− v-src cells, using Student's t test).
FIG. 7.
FIG. 7.
Only p27T187A reverts the rounded morphology of p27−/− v-src cells. (A) Representative pictures of the morphology acquired by p27T187A, p271-170, p27+/+, and p27−/− v-src-transformed fibroblasts after 10 h of inclusion in 3D collagen I. Pictures were collected by bright-field microscopy using a 10× objective. (B) Quantification of the cellular shape assumed by the indicated fibroblasts included in 3D collagen I. Cells were classified as rounded or elongated. The results represent the means (± standard deviations) from three independent experiments in which five randomly selected fields were counted. (C) Confocal images of p27+/+, p27−/−, p27T187A, and p271-170 v-src cells included for 10 h in 3D collagen I and then stained with phalloidin-AlexaFluor546 (pseudocolored in red) and antitubulin-FITC (pseudocolored in green). Bar, 24 μm. (D) Spheroids of the indicated cell lines were included in a 3D collagen matrix and observed by bright-field microscopy by collecting one picture every 5 min for at least 12 h. Photograms collected with a 20× objective after 0, 3, 6, and 9 h are reported. Bar, 50 μm.
FIG. 8.
FIG. 8.
Decreased MT stability accounts for the round shape and amoeboid motility of p27−/− v-src cells. (A) Matrix evasion assay of individual cells included in Matrigel (upper panels) or collagen I drops (lower panels). Typical images of matrix drops incubated for 24 h from inclusion at 37°C are shown. (B) Quantification of the experiment shown in panel A. The number of cells that exited from matrix drops within 24 h is reported. p27T187A (P < 0.001) but not p271-170 (P not significant using the Student t test) reduces matrix cell evasion compared to that in p27−/− v-src cells. Data represent the means and standard deviations from three independent experiments performed five times. (C) Confocal images of p27+/+, p27−/−, p27T187A, and p271-170 v-src cells included for 5 h in 3D collagen I and stained with anti-acetylated tubulin (gray scale) (upper panels). In the lower panels the merging of phalloidin-AlexaFluor546 (red), and anti-acetylated tubulin-AlexaFluor488 (green) is shown. Bar, 24 μm. (D) Quantification of the fluorescence intensity of acetylated tubulin normalized with phalloidin for at least 40 cells per cell clone (expressed in arbitrary units). Error bars indicate standard deviations. (E) FACS analysis of p27−/− v-src cells treated or not with 10 nM taxol for 10 h and analyzed for their cell cycle distribution. The percentage of cells in each phase of the cell cycle in a typical experiment is reported. (F) Spheroids of p27−/− v-src cells, treated or not with 10 nM taxol as indicated, were included in a 3D collagen matrix and evaluated by bright-field microscopy by collecting one picture every 5 min for at least 12 h. Photograms collected after 0, 3, 6, and 9 h are shown. Bar, 50 μm.
FIG. 9.
FIG. 9.
p27−/− v-src cells have higher RhoA activity. (A) p27+/+ and p27−/− v-src cells included in 3D collagen I were stained for pS3-cofilin (AlexaFluor488, pseudocolored in green) and nuclei (with propidium iodide, red). In the upper panels the confocal 3D reconstruction of pS3-cofilin staining is reported. In the middle, the merging of pS3-cofilin (AF488) and nuclei (red) in a 3D reconstruction is shown. In the lower panels a confocal section of the same field is reported. Bar, 24 μm. (B) Quantification of the fluorescence intensity of pS3-cofilin in at least 40 cells per genotype (expressed in arbitrary units). Error bars indicate standard deviations. (C) Western blot analysis of pS3-cofilin and total cofilin expression in p27+/+, p27−/−, p27T187A, and p271-170 v-src cells adhered to collagen I (20 μg/ml) for the indicated times. (D) Quantification of pS3-cofilin, representing the ratio between pS3-cofilin and total cofilin expression in three independent experiments (*, P = 0.01; P = 0.005 [at 60 min between p27+/+ and p27−/− cells and p271-170 and p27+/+ cells, respectively, using the Student t test; in the other cases the differences did not reach statistical significance). Error bars indicate standard deviations.
FIG. 10.
FIG. 10.
p27T187A expression reduces the invasive potential of p27−/− v-src cells. (A) Nude mice subcutaneously injected with the indicated cell clones were analyzed for the presence of circulating cells by RT-PCR analysis of spleen samples. The results are shown as the percentage of positive spleens. (B) Representative pictures of lungs explanted from nude mice injected in the tail vein with the indicated v-src fibroblasts and sacrificed 20 days after injection. Lungs were fixed in Bouin's solution. The number of macroscopically detectable foci in the two lungs is indicated. (C) Immunohistochemistry analysis of p27 expression in lung sections from mice injected with p27T187A and p271-170 v-src fibroblasts. The expression of p27T187A (left panel) is lost in the lung tumor foci. In the same section the expression of endogenous mouse p27 retained in the normal lung islet entrapped in the tumor metastasis is visible. Conversely, p271-170 expression (right panel) is retained both in the nucleus and in the cytoplasm of the transformed cells (better seen in the inset; magnification, ×40).

References

    1. Baldassarre, G., B. Belletti, M. S. Nicoloso, M. Schiappacassi, A. Vecchione, P. Spessotto, A. Morrione, V. Canzonieri, and A. Colombatti. 2005. p27(Kip1)-stathmin interaction influences sarcoma cell migration and invasion. Cancer Cell 751-63. - PubMed
    1. Baldassarre, G., B. Belletti, P. Bruni, A. Boccia, F. Trapasso, F. Pentimalli, M. V. Barone, G. Chiappetta, M. T. Vento, S. Spiezia, A. Fusco, and G. Viglietto. 1999. Overexpressed cyclin D3 contributes to retaining the growth inhibitor p27 in the cytoplasm of thyroid tumor cells. J. Clin. Investig. 104865-874. - PMC - PubMed
    1. Belletti, B., M. S. Nicoloso, M. Schiappacassi, E. Chimienti, S. Berton, F. Lovat, A. Colombatti, and G. Baldassarre. 2005. p27(kip1) functional regulation in human cancer: a potential target for therapeutic designs. Curr. Med. Chem. 121589-1605. - PubMed
    1. Belletti, B., M. S. Nicoloso, M. Schiappacassi, S. Berton, F. Lovat, K. Wolf, V. Canzonieri, S. D'Andrea, A. Zucchetto, P. Friedl, A. Colombatti, and G. Baldassarre. 2008. Stathmin activity influences sarcoma cell shape, motility, and metastatic potential. Mol. Biol. Cell 192003-2013. - PMC - PubMed
    1. Besson, A., M. Gurian-West, A. Schmidt, A. Hall, and J. M. Roberts. 2004. p27Kip1 modulates cell migration through the regulation of RhoA activation. Genes Dev. 18862-876. - PMC - PubMed

Publication types

Substances

LinkOut - more resources