. 2009 Jul 13;186(1):113-28.
doi: 10.1083/jcb.200811071.

Ca(2+) signaling evoked by activation of Na(+) channels and Na(+)/Ca(2+) exchangers is required for GABA-induced NG2 cell migration

Affiliations

Ca(2+) signaling evoked by activation of Na(+) channels and Na(+)/Ca(2+) exchangers is required for GABA-induced NG2 cell migration

Xiao-ping Tong et al. J Cell Biol. .

Abstract

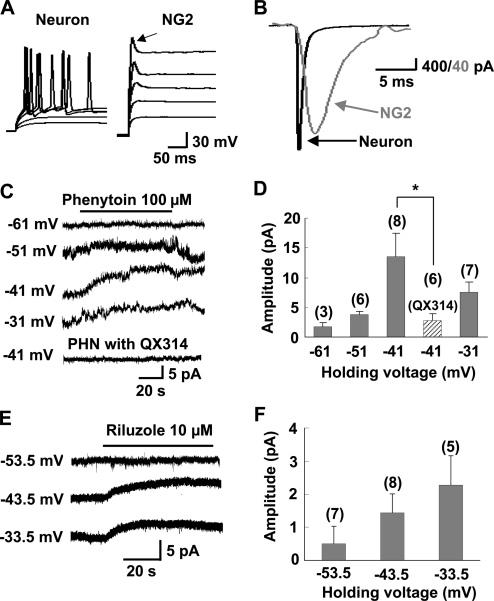
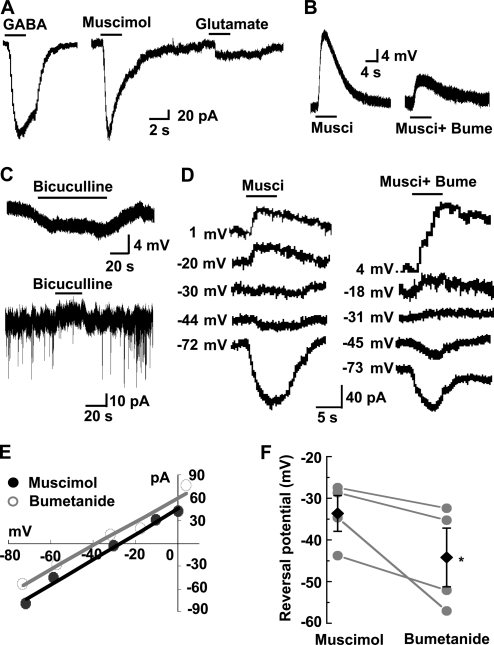
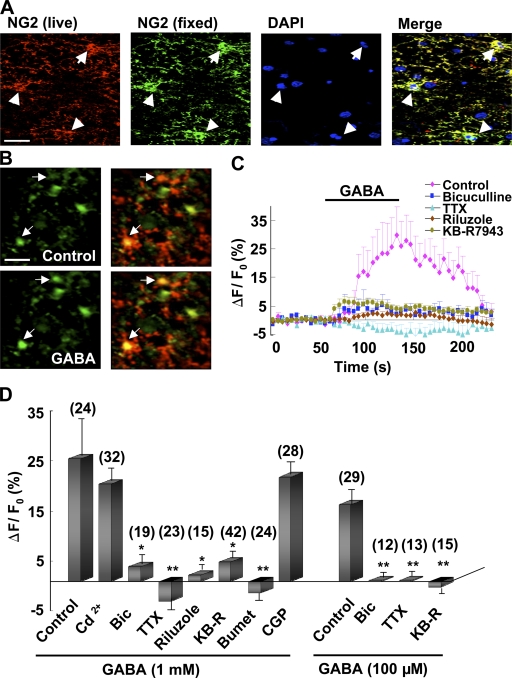
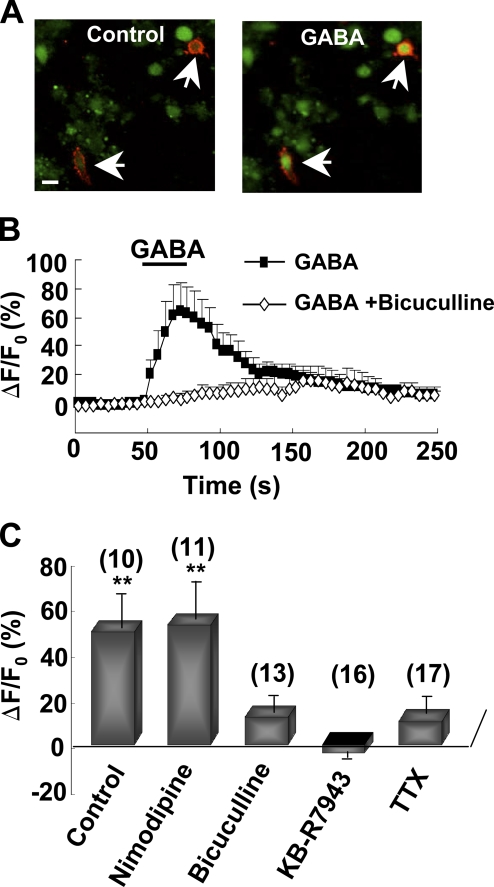
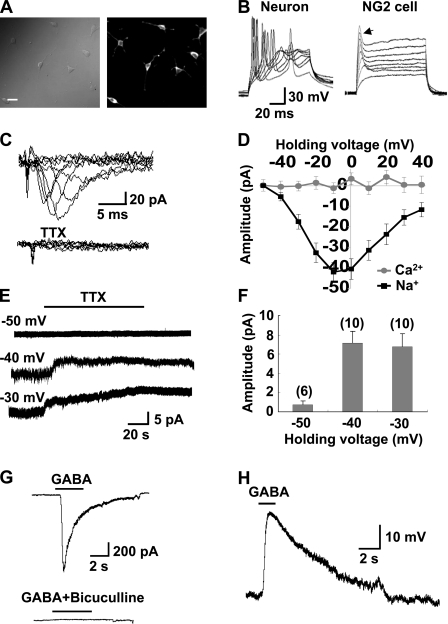
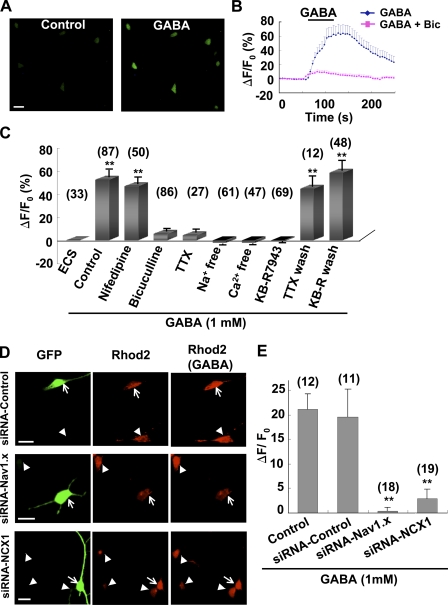
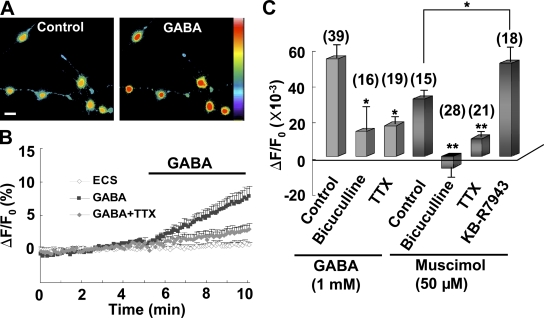
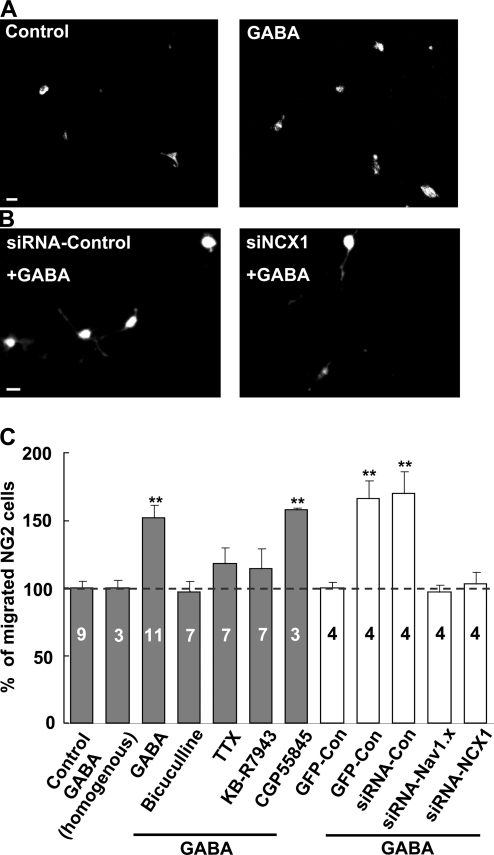
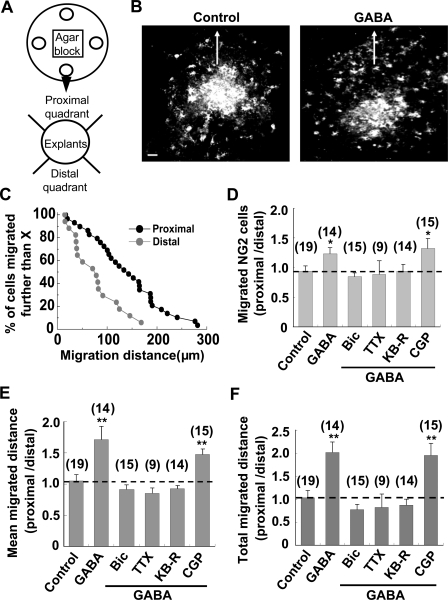
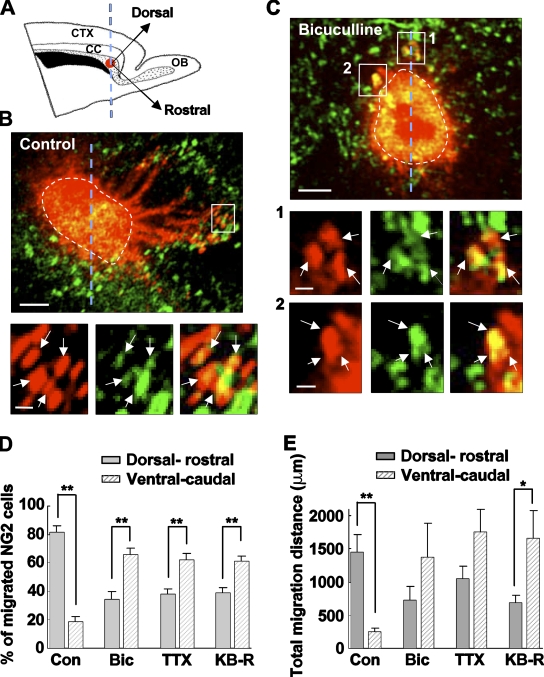
NG2 cells originate from various brain regions and migrate to their destinations during early development. These cells express voltage-gated Na(+) channels but fail to produce typical action potentials. The physiological role of Na(+) channels in these cells is unclear. We found that GABA induces membrane depolarization and Ca(2+) elevation in NG2 cells, a process requiring activation of GABA(A) receptors, Na(+) channels, and Na(+)/Ca(2+) exchangers (NCXs), but not Ca(2+) channels. We have identified a persistent Na(+) current in these cells that may underlie the GABA-induced pathway of prolonged Na(+) elevation, which in turn triggers Ca(2+) influx via NCXs. This unique Ca(2+) signaling pathway is further shown to be involved in the migration of NG2 cells. Thus, GABAergic signaling mediated by sequential activation of GABA(A) receptors, noninactivating Na(+) channels, and NCXs may play an important role in the development and function of NG2 glial cells in the brain.


Figures

Figure 1.
Figure 1.
Persistent Na+ currents recorded from NG2 cells in hippocampal slices. (A) Superimposed membrane potential changes in an NG2 cell and a pyramidal neuron in response to a series of current injections (300 ms in duration with an interval of 15 s) from a holding potential of −70 and −60 mV, respectively. In the NG2 cell, only a single small spikelike depolarizing transient (arrow) could be evoked upon each super-threshold depolarizing current injection. (B) Comparison of the kinetics of Na+ currents recorded from a NG2 cell with those recorded from a neuron evoked by a depolarizing voltage pulse at −20 mV. (C) Example recordings from NG2 cells showing phenytoin-induced persistent outward current at −41 or −31 mV holding membrane potential and its blockage by intracellular loading QX314 (5 mM; bottom trace). (D) Mean amplitude of phenytoin-induced outward currents recorded at various membrane potentials as shown in C. The number associated with each column refers to the number of cells examined in each condition. *, P < 0.05 compared with the group as indicated. (E) Perfusion with riluzole also revealed an apparent persistent outward current at depolarizing membrane potentials. (F) Mean amplitude of riluzole-induced outward currents recorded at various membrane potentials as shown in E. Error bars represent mean ± SEM.
Figure 2.
Figure 2.
GABAAR-mediated responses in NG2 cells in hippocampal slices under gramicidin-perforated patch recording. (A) Comparing the 100 µM GABA-, 50 µM muscimol-, and 100 µM glutamate-induced currents in a single NG2 cell. (B) 50 µM muscimol-induced depolarization and its inhibition by treatment with 10 µM bumetanide. (C, top) Perfusion with 10 µM bicuculline induced a membrane hyperpolarization in an NG2 cell, which indicates a persistent membrane depolarization induced by the tonic released GABA. (C, bottom) An example of a voltage-clamp recording from an NG2 cell showing that bicuculline not only induced a persistent outward current, but also blocked the spontaneous transient inward currents, demonstrating the tonic and phasic GABA release sensed by the NG2 cell in the brain slice. (D) The 50 µM muscimol-evoked currents in a single NG2 cell were estimated at various membrane potential levels in the presence and absence of 10 µM bumetanide. The number at the left of each trace indicates membrane potential (Vm) after correction for access resistance (see Materials and methods). (E) Current-voltage (I-V) plots of the muscimol-evoked currents shown in D. Regression lines were made based on the plotted data. (F) Summary of the reversal potentials of the muscimol-evoked currents determined by the intersection of the regression lines at the x axis of I-V plots shown in E. Each line connects the data collected from the same cell in the absence (left) and presence (right) of 10 µM bumetanide. Black diamonds represent mean reversal potentials in each group. *, P < 0.05 compared with the muscimol group. Error bars represent mean ± SEM.
Figure 3.
Figure 3.
GABA-induced [Ca2+]i elevation in NG2 cells in hippocampal slices. (A) The slice was live stained with NG2 (red, anti–mouse) and then fixed by 4% paraformaldehyde for the secondary anti-NG2 immunostaining (green, anti–rabbit). The two sets of staining colocalized nicely, which excluded the possibility of nonspecific staining of live cells due to endocytosis of the antibody. The nucleus was stained by DAPI (blue). Typical NG2 cells are indicated by white arrows and arrowheads. Bar, 20 µm. (B) Confocal images of NG2 cells loaded with Fluo-4 AM (green). The NG2 cells were identified by live immunostaining with anti-NG2 (red). Note the increased [Ca2+]i in NG2 cells (indicated by arrows) during 1 mM GABA perfusion. 500 µM kynurenic acid was added to block potential secondary activation of glutamate receptors. Bar, 20 µm. (C) Time course of GABA-induced [Ca2+]i changes in NG2 cells with or without the presence of various inhibitors. (D) Summary of GABA-induced [Ca2+]i changes in NG2 cells as shown in C. Data were averaged during 55–105 s after the onset of perfusion with GABA, and normalized by the mean fluorescence intensity obtained during the control period (0–50 s before GABA perfusion) for each cell. *, P < 0.05; **, P < 0.01 compared with the corresponding control group. Error bars represent mean ± SEM.
Figure 4.
Figure 4.
GABA-induced [Ca2+]i elevation in acutely dissociated NG2 cells. (A) Images of acutely dissociated NG2 cells (arrows) loaded with the Fluo4-AM (green) and identified by live immunostaining with anti-NG2 (red). Images were taken from the same imaging field before (control) and during perfusion with 1 mM GABA. Bar, 10 µm. (B) Time course of [Ca2+]i changes in dissociated NG2 cells perfusion with 1 mM GABA with or without 10 µM bicuculline. (C) Summary of GABA-induced [Ca2+]i changes in dissociated NG2 cells with or without various inhibitors. Data were averaged during 20–50 s after the onset of perfusion with GABA, and normalized by the mean fluorescence intensity obtained during the control period (0–50 s before GABA perfusion) for each cell. **, P < 0.01 compared with ECS group not treated with GABA. Error bars represent mean ± SEM.
Figure 5.
Figure 5.
Electrophysiological properties of cultured NG2 cells. (A) Phase contrast (left) and fluorescence (right) images of purified NG2 cells immunostained with anti-NG2 antibody. Bar, 20 µm. (B) Comparison of the properties of membrane potential changes in a cultured NG2 cell and a neuron in response to a series of depolarizing current injections with an increment of 50 pA at an interval of 10 s at a −70 mV holding potential. Note the increased amplitude of the initial transient depolarizations (arrow) in the NG2 cell. (C) TTX-sensitive transient Na+ currents (top traces) recorded from a cultured NG2 cell evoked by voltage steps (100 ms, 10 mV increment) from −60 to +50 mV, with a 300-ms prepulse of −110 mV. (D) I-V plots of Na+ and Ca2+ currents in cultured NG2 cells evoked by depolarizing voltage steps as shown in C. Note the lack of apparent voltage-gated Ca2+ currents in NG2 cells. (E) Recording traces from a cultured NG2 cell showing that perfusion with 0.5 µM TTX revealed a persistent outward current at −40 or −30 mV, but not at a −50 mV holding membrane potential. (F) Mean amplitude of TTX-induced outward currents recorded under various membrane potentials as shown in E. Error bars represent mean ± SEM. (G) Whole-cell recording from a cultured NG2 cell showing 50 µM GABA–induced inward current and its blockade by 10 µM bicuculline at −70 mV membrane potential. (H) 1 mM GABA–induced depolarization in an NG2 cell under gramicidin-perforated recording at −70 mV membrane potential.
Figure 6.
Figure 6.
GABA-induced [Ca2+]i elevation in cultured NG2 cells. (A) Confocal images of cultured NG2 cells loaded with Fluo-4 AM before (control) and during perfusion with 1 mM GABA. Bar, 20 µm. (B) Averaged time course of 1 mM GABA–induced [Ca2+]i elevation in cultured NG2 cells and its blockage by 10 µM bicuculline. (C) Summary of [Ca2+]i changes in NG2 cells perfused with normal solution (ECS) or solution containing 1 mM GABA with or without (control) various treatments. Data are averaged during 30–80 s after the onset of perfusion with GABA, normalized by the mean fluorescence intensity obtained during the control period (0–50 s before GABA perfusion) for each cell. TTX wash and KB-R wash, recovery of the GABA-induced [Ca2+]i elevation after 10 min and 5 min wash out of 1 µM TTX and 10 µM KB-R7943, respectively. **, P < 0.01 compared with ECS group. (D, left) Confocal images of cultured NG2 cells cotransfected with pGFP + scrambled siRNA (siRNA-Control), pGFP + siRNA-Nav1.x, or pGFP+siRNA-NCX1, respectively. (D, middle and right) [Ca2+]i images of untransfected (arrowheads) and transfected (arrows) NG2 cells loaded with the Ca2+ dye Rhod2 AM before and during perfusion with 1 mM GABA, respectively. Images in each row were sampled from the same field. Note that GABA induced apparent [Ca2+]i elevation in untransfected cells or cells transfected with siRNA-control, but not in cells transfected with either siRNA-Nav1.x or siRNA-NCX1. Bars, 20 µm. (E) Summary of GABA-induced [Ca2+]i changes in NG2 cells with or without various transfections. Data are averaged during 30–100 s after the onset of perfusion with GABA, subtracted by the mean fluorescence intensity obtained during the control period (0–50 s before GABA perfusion) for each cell. **, P < 0.01 compared with siRNA control group. Error bars represent mean ± SEM.
Figure 7.
Figure 7.
GABA-induced [Na+]i elevation in cultured NG2 cells. (A) Confocal images of cultured NG2 cells preloaded with the Na+ dye SBFI/AM. Images were taken from the same imaging field before (control) and during perfusion with 1 mM GABA. Bar, 25 µm. (B) Averaged data showing the time course of [Na+]i changes in cultured NG2 cells under control or perfusion with GABA with or without 1 µM TTX. (C) Summary of GABA- and muscimol-induced [Na+]i changes in NG2 cells in the presence or absence (control) of various inhibitors. Data were averaged during 3–5 min after the onset of perfusion with 1 mM GABA or 50 µM muscimol, and normalized by the mean fluorescence intensity obtained during the control period (0–5 min before perfusion with GABA or muscimol) for each cell. *, P < 0.05; **, P < 0.01 compared with the control group or between groups indicated. Error bars represent mean ± SEM.
Figure 8.
Figure 8.
GABA promoted migration of cultured NG2 cells. (A) Images showing migrated cells immunopositive for anti-NG2 staining without (control) or with 1 mM GABA added to the bottom chamber of the transwell (see Materials and methods). Bar, 20 µm. (B) Images showing migration of purified NG2 cells cotransfected with pGFP + siRNA-control or pGFP + siRNA-NCX1 in the presence of 1 mM GABA at the bottom chamber of the transwell. Bar, 20 µm. (C) Summary data showing the GABA-induced migration of purified NG2 cells with or without various inhibitors or siRNA transfections. Data are normalized as the percentage of migrated NG2 cells in control (gray) or GFP-control (white) group (broken line; without GABA in the bottom chamber), respectively. Note that homogeneous GABA (1 mM, added in both top and bottom chambers) did not affect NG2 cell migration. **, P < 0.01 compared with the control or GFP control group, respectively. Error bars represent mean ± SEM.
Figure 9.
Figure 9.
GABA promoted migration of NG2 cells in tissue explant preparations. (A) Schematic diagram of the tissue explant migration assay. Four SVZa explants (open circles) were cultured on one poly-d-lysine–coated coverslip. 1 or 2 d after culturing, GABA (50 mM, 50 µl) with or without various inhibitors was added to the well on top of the agarose block (8 mm on a side) sitting in the center of the coverslip to create a concentration gradient of the drugs in the medium surrounding the agarose block. (B) Images of anti-NG2 immunostaining showing the asymmetric or symmetric distribution of NG2 cells migrating from the edge of the explant with or without GABA added to the agarose block. Arrows indicate the direction of the agarose block. Bar, 50 µm. (C) Accumulated distribution of migrated NG2 cells in the proximal and distal quadrants of the SVZa explant in the presence of a GABA-containing agarose block as shown in B. x axis, final distance of migrated NG2 cells from the edge of the explants. y axis, percentage of NG2 cells that migrated further than the distance indicated on the x axis. (D) Averaged ratio (proximal/distal quadrants) of NG2 cells migrating out of explants under various conditions. The number of migrated NG2 cells in the proximal quadrant of the explant was normalized with that in the distal quadrant of the same explant. The number associated with each column represents the number of explants examined. *, P < 0.05 compared with control group. (E) Averaged ratio (proximal/distal quadrants) of the mean migration distance of NG2 cells from the edge of explants under various conditions. The mean migration distance of NG2 cells in the proximal quadrant of the explant was normalized with that in the distal quadrant of the same explant. Data were analyzed from the same explants as shown in D. **, P < 0.01 compared with control group. (F) Averaged ratio (proximal/distal quadrants) of the total migration distance of NG2 cells from the edge of SVZ explants under various conditions. The summed migration distance of all the NG2 cells in the proximal quadrant of the explant was normalized with that in the distal quadrant of the same explant. Data were analyzed from the same explants as shown in D. **, P < 0.01 compared with the control group. Error bars represent mean ± SEM.
Figure 10.
Figure 10.
Involvement of endogenous GABA in the in situ migration of SVZ NG2 cells. (A) Schematic representation of the rat sagittal brain slice showing the location of DiI-stained area (red circle) in the SVZ (gray area). Two arrows indicate the rostral direction (starting from the center of the DiI-stained area and along the longitude axis of the SVZ to the olfactory bulb direction) and dorsal direction (perpendicular with the rostral direction), respectively. The broken blue line crossing the center of the DiI-stained area and forming 45° angles with the two arrows separates the DiI-stained area into the dorsal–rostral (the right side of the broken blue line) and ventral–caudal (the left side of the broken blue line) parts for analyzing cell migration (see below). CC, corpus callosum; CTX, cortex; OB, olfactory bulb. (B, top) Confocal image of the control slice 18 h after live staining with anti-NG2 (green) and DiI crystal (red) showing asymmetric distribution of DiI-labeled cells around the DiI-stained area (outlined by the broken line). Note that more DiI-stained cells, either NG2 positive or NG2 negative, migrated out of the DiI-stained area in the dorsal–rostral side (the right side of the broken line) than those in the ventral–caudal side (the left side of the broken line). Bar, 100 µm. (B, bottom) Higher magnification of the boxed area in the top panel showing that NG2 cells (stained with both DiI and anti-NG2, indicated by arrows) migrated out of the DiI-stained area. Bar, 20 µm. (C, top) Confocal image of the bicuculline-treated slice 18 h after live staining with anti-NG2 (green) and DiI crystal (red) showing symmetric distribution of DiI-labeled cells around the DiI-stained area (outlined by the broken line). Bar, 100 µm. (middle and bottom) Higher magnification of the boxed areas 1 and 2 in the top panel, respectively, showing that double-stained NG2 cells (indicated by arrows) migrated out of the DiI-stained area. Bars, 20 µm. (D) Averaged ratio (number of the migrated NG2 cells in one side/total number of the migrated NG2 cells) of NG2 cells migrating out of the DiI-stained area in the absence (control) or presence of 10 µM bicuculline (Bic), 1 µM TTX, or 10 µM KB-R7943 (KB-R). (E) Averaged total migration distance of NG2 cells (summed migration distance from all the migrated NG2 cells in one side) starting from the edge of the DiI-stained area under various conditions. Data were analyzed from the same brain slices as shown in D. *, P < 0.05; **, P < 0.01 compared between the two groups indicated. n = 23, 13, 9, and 11 slices for control, bicuculline, TTX, and KB-R7943 groups, respectively. Error bars represent mean ± SEM.

References

    1. Aguirre A., Dupree J.L., Mangin J.M., Gallo V. 2007. A functional role for EGFR signaling in myelination and remyelination.Nat. Neurosci. 10:990–1002 - PubMed
    1. Akerman C.J., Cline H.T. 2007. Refining the roles of GABAergic signaling during neural circuit formation.Trends Neurosci. 30:382–389 - PubMed
    1. Annunziato L., Pignataro G., Di Renzo G.F. 2004. Pharmacology of brain Na+/Ca2+ exchanger: from molecular biology to therapeutic perspectives.Pharmacol. Rev. 56:633–654 - PubMed
    1. Barker G.A., Diamond S.L. 2008. RNA interference screen to identify pathways that enhance or reduce nonviral gene transfer during lipofection.Mol. Ther. 16:1602–1608 - PMC - PubMed
    1. Barres B.A., Koroshetz W.J., Swartz K.J., Chun L.L., Corey D.P. 1990. Ion channel expression by white matter glia: the O-2A glial progenitor cell.Neuron. 4:507–524 - PubMed

Publication types

MeSH terms