. 2009 Sep 18;284(38):26085-95.
doi: 10.1074/jbc.M109.018473. Epub 2009 Jul 13.

Syndecan-1 is required for robust growth, vascularization, and metastasis of myeloma tumors in vivo

Affiliations

Syndecan-1 is required for robust growth, vascularization, and metastasis of myeloma tumors in vivo

Yekaterina B Khotskaya et al. J Biol Chem. .

Abstract

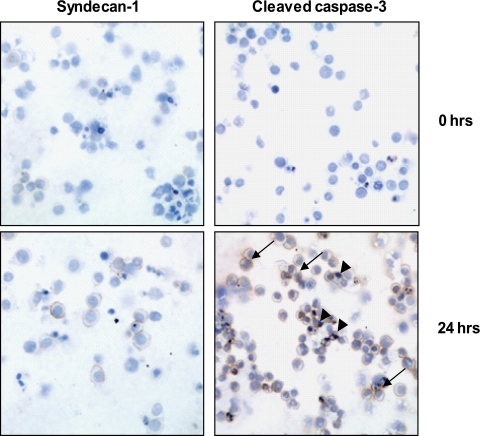
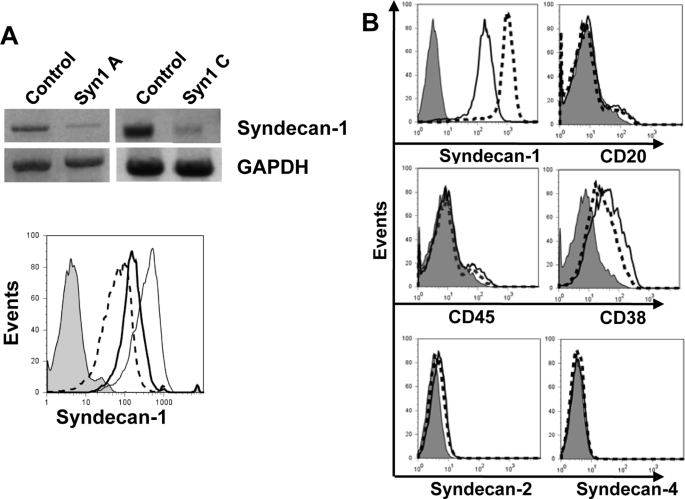
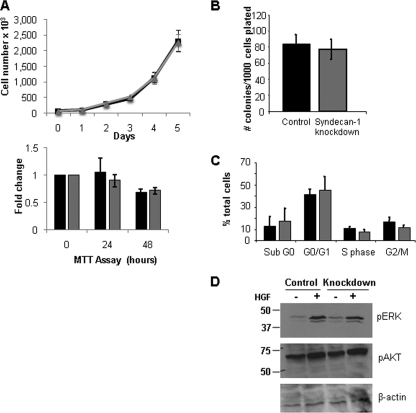
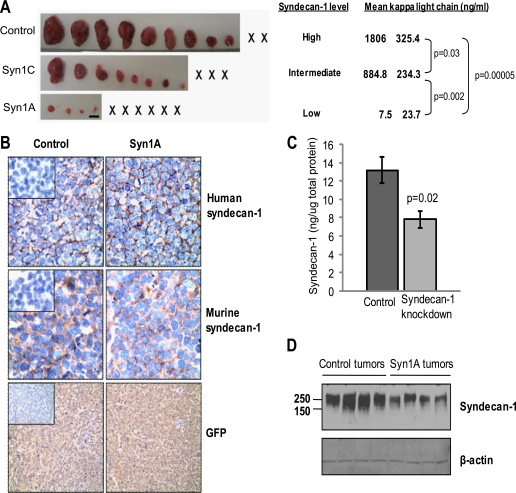
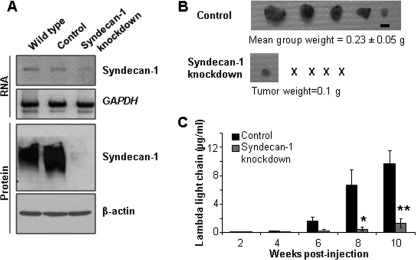
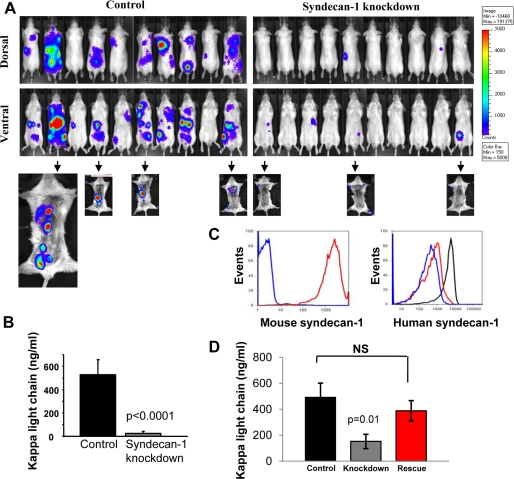
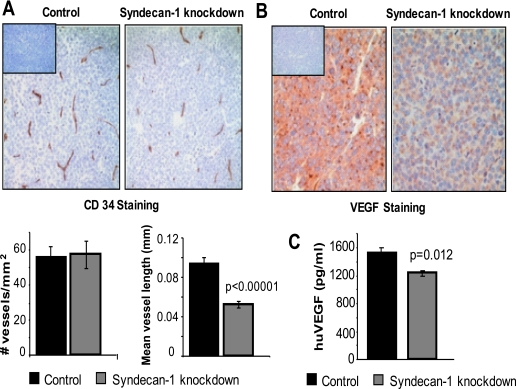
Myeloma tumors are characterized by high expression of syndecan-1 (CD138), a heparan sulfate proteoglycan present on the myeloma cell surface and shed into the tumor microenvironment. High levels of shed syndecan-1 in the serum of patients are an indicator of poor prognosis, and numerous studies have implicated syndecan-1 in promoting the growth and progression of this cancer. In the present study we directly addressed the role of syndecan-1 in myeloma by stable knockdown of its expression using RNA interference. Knockdown cells that were negative for syndecan-1 expression became apoptotic and failed to grow in vitro. Knockdown cells expressing syndecan-1 at approximately 28% or approximately 14% of normal levels survived and grew well in vitro but formed fewer and much smaller subcutaneous tumors in mice compared with tumors formed by cells expressing normal levels of syndecan-1. When injected intravenously into mice (experimental metastasis model), knockdown cells formed very few metastases as compared with controls. This indicates that syndecan-1 may be required for the establishment of multi-focal metastasis, a hallmark of this cancer. One mechanism of syndecan-1 action occurs via stimulation of tumor angiogenesis because tumors formed by knockdown cells exhibited diminished levels of vascular endothelial growth factor and impaired development of blood vessels. Together, these data indicate that the effects of syndecan-1 on myeloma survival, growth, and dissemination are due, at least in part, to its positive regulation of tumor-host interactions that generate an environment capable of sustaining robust tumor growth.


Figures

FIGURE 1.
FIGURE 1.
Syndecan-1-negative myeloma cells undergo apoptosis in vitro. CAG myeloma cells were transduced with a lentiviral vector delivering syn1A shRNA sequence. The cells were sorted by FACS to select the syndecan-1-negative population. Cytospin preparations immunostained for syndecan-1 immediately following cell sorting confirm that the cells are negative for syndecan-1 expression and for cleaved caspase-3. 24 h after cell sorting, a number of cells stain positively for cleaved caspase-3, indicating that they are undergoing apoptosis (brown reaction product, arrows; original magnification, ×200). The slides were counterstained with hematoxylin to identify nuclei. The arrowheads point to condensed nuclei indicative of apoptotic cell death.
FIGURE 2.
FIGURE 2.
shRNA reduces expression of syndecan-1 but does not alter the myeloma cell phenotype. A, CAG myeloma cells were transduced with lentiviral vectors delivering control, syn1A, or syn1C shRNA sequences. Stable knockdown of syndecan-1 was confirmed by RT-PCR (top panel) and flow cytometry (bottom panel): IgG control antibody (shaded), control cells expressing wild-type levels of syndecan-1 (thin solid line), syn1A cells (dashed line), and syn1C cells (thick solid line). B, control cells (dashed line) and syn1A knockdown cells (solid line) were stained for markers of B cell lineage CD20, CD38, and CD45, or for syndecan-1, -2, or -4, or with control IgG antibody (shaded peak) and analyzed by flow cytometry. The gates were set on live, GFP+ cells. GAPDH, glyceraldehyde-3-phosphate dehydrogenase.
FIGURE 3.
FIGURE 3.
Reduction in the level of syndecan-1 expression does not alter the in vitro growth characteristics of the CAG myeloma cells. A, upper panel, equal number of control or syndecan-1 knockdown cells were plated in complete growth medium, and the cell numbers were assessed by direct counts. A single experiment representative of three independent assessments is shown. The data are the means ± S.D. Lower panel, equal numbers of control (black bar) and syndecan-1 knockdown (gray bar) cells were plated in serum-free medium, and cell density was determined by the 3-(4,5-dimethylthiazol-2-yl)-2,5-diphenyltetrazolium bromide (MTT) assay. The data are the means ± S.E. (n = 3). B, control and knockdown cells were plated in semi-solid methylcellulose media in triplicate. Following 10 days of growth, the number of colonies consisting of over 50 cells was manually counted. The data are the means ± S.E. (n = 3). C, 106 control (black bars) or knockdown (gray bars) cells were fixed in ethanol, stained with propidium iodide, and analyzed for DNA content on FACSCalibur. The data are the means ± S.E. (n = 3). D, equal number of CAG control or syndecan-1 knockdown cells were serum-starved overnight and then treated with recombinant HGF for 30 min. Cell lysates were analyzed for expression of phospho-ERK, phospho-Akt, and β-actin by immunoblotting.
FIGURE 4.
FIGURE 4.
Knockdown of syndecan-1 expression diminishes subcutaneous growth of myeloma cells. A, 5 weeks after subcutaneous injection of control and syndecan-1 knockdown CAG cells into flanks of male SCID mice, the tumors were removed at necropsy and photographed (× represents animals with no detectable tumor; bar, 1 cm). The levels of human κ light chain in the serum were measured by ELISA and reflect the tumor burden in the mice 4 weeks after injection of tumor cells. B, immunohistochemical analysis of tumors for human and murine syndecan-1 (original magnification, ×400) and GFP expression (original magnification, ×200) are shown. Insets, negative control. C, tissue extracts prepared from tumors formed by the control (n = 5) and syn1A (n = 4) cells were analyzed by ELISA for levels of human syndecan-1. The data are the means ± S.E. D, extracts from tumors growing in animals injected with control or syn1A myeloma cells were resolved on SDS-PAGE and levels of human syndecan-1 (Syn1) assessed by Western blotting. The blot includes extracts of individual tumors from each of four animals from each group.
FIGURE 5.
FIGURE 5.
Reduction of syndecan-1 levels in RPMI-8226 human myeloma cells yields results similar to CAG syndecan-1 knockdown cells. A, knockdown of syndecan-1 upon transduction with the syn1A sequence was confirmed by RT-PCR (upper two panels) and Western blotting (lower two panels). The data are the means ± S.E. (n = 3). B, 5 × 10⁶ control or knockdown cells were injected subcutaneously into the flanks of male SCID mice. At necropsy, the tumors were resected, weighed, and photographed (× represents animals with no detectable tumor; bar, 1 cm). C, murine sera were subjected to ELISA to assess levels of human immunoglobulin λ light chain as an indicator of whole animal tumor burden. The data are the means ± S.E. For control versus knockdown, *, p = 0.042; **, p = 0.006.
FIGURE 6.
FIGURE 6.
Knockdown of syndecan-1 dramatically inhibits disseminated growth of myeloma. Luciferase-tagged CAG control and syn1A knockdown cells were injected via tail vein into male SCID mice (experimental metastasis model). A, dorsal and ventral bioluminescent images shown are from all animals in a single experiment 5 weeks after the injection of tumor cells and are representative of two independent experiments (total animal number from two experiments: control, n = 18; syn1A, n = 20). Arrows point to images from animals following removal of visceral organs. Control cells showed a higher propensity toward growth in the bone as compared with knockdown cells. B, murine sera were collected at termination of the experiment and subjected to ELISA to assess levels of human immunoglobulin κ light chain as an indicator of whole animal tumor burden. The data are the means ± S.E. C, CAG syndecan-1 knockdown cells stably transfected to express full-length mouse syndecan-1 core protein were stained with 281.2 antibody (red) that specifically recognizes murine syndecan-1 or with control IgG (blue) and analyzed by flow cytometry. Expression of human syndecan-1 was also assessed in control (black) and syndecan-1 knockdown cells pre- (blue) and post-transfection (red) with mouse syndecan-1. The gates were set on live, GFP+ cells. D, 5 × 10⁶ control, syndecan-1 knockdown, and knockdown cells expressing murine syndecan-1 (rescue cells) were injected intravenously into male SCID mice. Mouse serum was subjected to ELISA to assess levels of human immunoglobulin κ light chain as an indicator of whole animal tumor burden. The data are the means ± S.E. The data shown are from all of the animals (control, n = 10; syn1A, n = 10; mouse rescue, n = 9) in a single 5-week experiment and are representative of two independent studies. NS, not significant.
FIGURE 7.
FIGURE 7.
Tumors formed by syndecan-1 knockdown cells have a poorly developed vasculature and decreased levels of human VEGF. A, immunohistochemistry of xenograft tumor tissues from tumors formed by control or syn1A knockdown cells and stained with antibody to CD34 (brown) and counterstained with hematoxylin (blue) (original magnification, ×200). Inset, negative control. Bar graphs, quantification of microvessel density and average vessel length. The data are the means ± S.E. B, immunohistochemistry for human VEGF (brown) in xenograft tumor sections counterstained with hematoxylin (blue). Inset, antibody negative control (original magnification, ×400). C, medium conditioned by myeloma cells for 48 h was collected and levels of human VEGF assessed by ELISA. The data are the means ± S.E. (n = 3).

References

    1. Barlogie B., Shaughnessy J., Epstein J., Sanderson R., Anaissie E., Walker R., Tricot G. (2006) in Williams Hematology ( Lichtman M. A., Beutler E., Kipps T. J., Seligsohn U., Kaushansky K., Prchal J. T. eds) 7th Ed., pp. 1501–1533, McGraw-Hill, New York
    1. Anderson K. C. (2007) Exp. Hematol. 35, 155–162 - PubMed
    1. Roodman G. D. (2002) J. Bone Miner. Res. 17, 1921–1925 - PubMed
    1. Caers J., Van Valckenborgh E., Menu E., Van Camp B., Vanderkerken K. (2008) Bull. Cancer 95, 301–313 - PubMed
    1. Sanderson R. D., Yang Y. (2008) Clin. Exp. Metastasis 25, 149–159 - PMC - PubMed

Publication types

MeSH terms