. 2009 Sep 11;284(37):24869-80.
doi: 10.1074/jbc.M109.025932. Epub 2009 Jul 13.

Mechanisms of resistance to interferon-gamma-mediated cell growth arrest in human oral squamous carcinoma cells

Affiliations

Mechanisms of resistance to interferon-gamma-mediated cell growth arrest in human oral squamous carcinoma cells

Miki Hiroi et al. J Biol Chem. .

Abstract

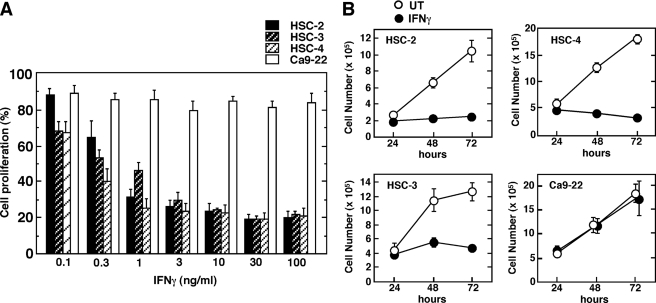
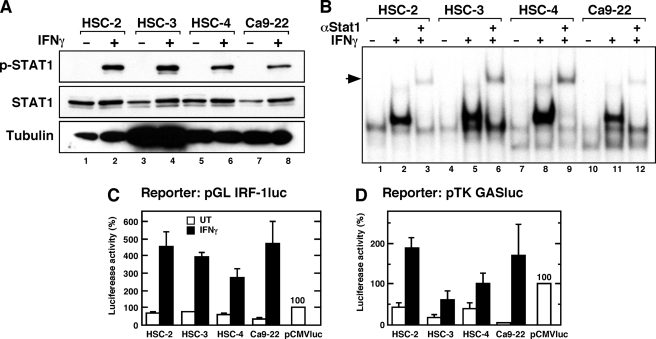
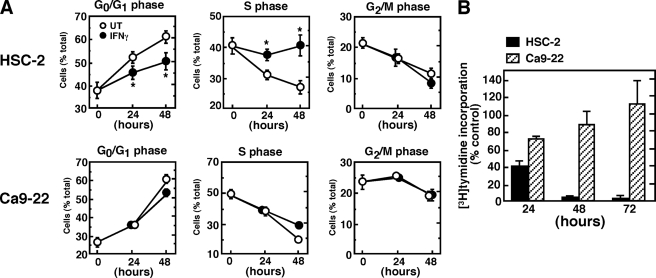
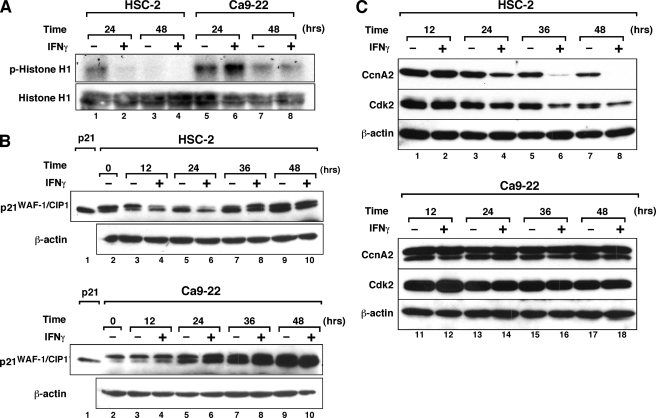
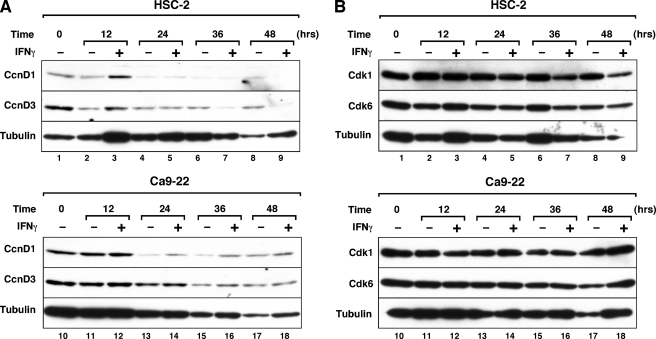
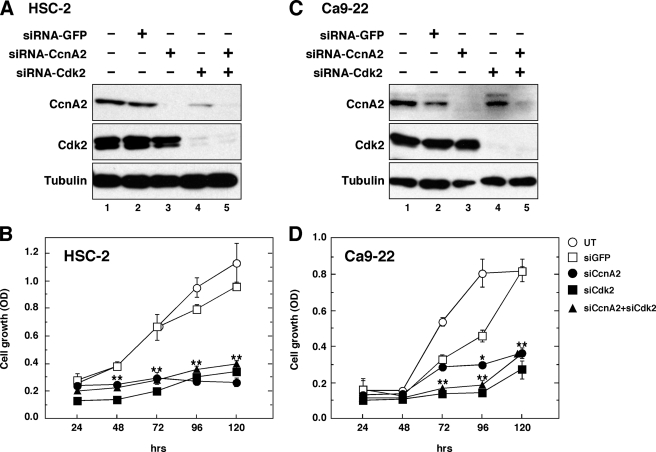
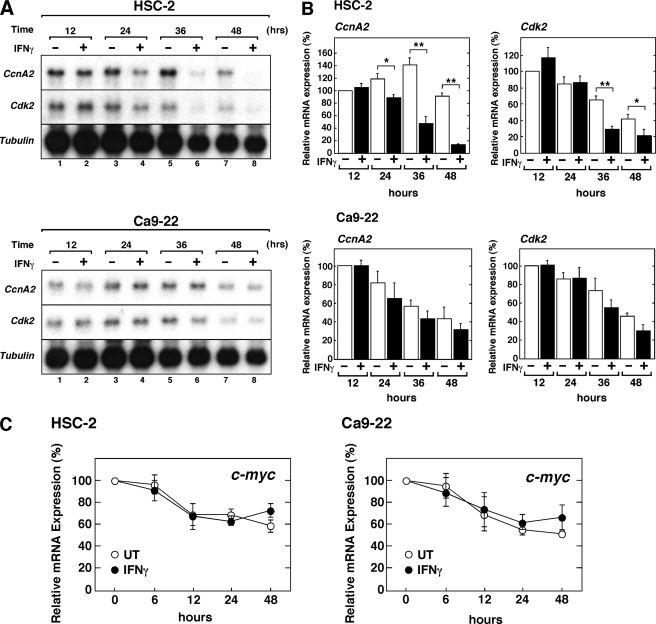
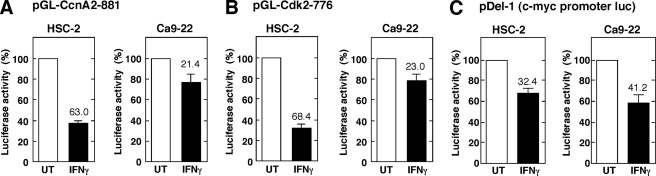
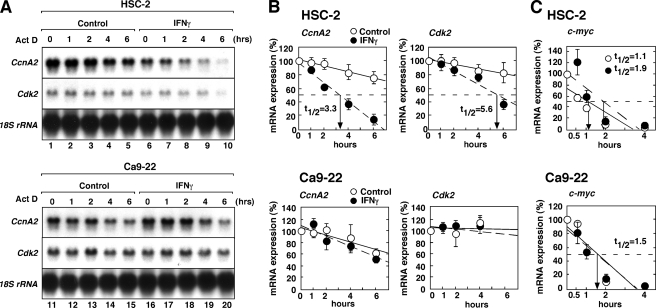
Interferon-gamma (IFNgamma) has an antiproliferative effect on a variety of tumor cells. However, many tumor cells resist treatment with IFNs. Here, we show that IFNgamma fails to inhibit the growth of some types of oral squamous cell carcinoma (OSCC) cells that possess a fully functional IFNgamma/STAT1 (signal transducer and activator of transcription-1) signaling pathway. IFNgamma inhibited the growth of the HSC-2, HSC-3, and HSC-4 OSCC cell lines. However, Ca9-22 cells were resistant to IFNgamma despite having intact STAT1-dependent signaling, such as normal tyrosine phosphorylation, DNA binding activity, and transcriptional activity of STAT1. The growth inhibition of HSC-2 cells resulted from S-phase arrest of the cell cycle. IFNgamma inhibited cyclin A2 (CcnA2)-associated kinase activity, which correlated with the IFNgamma-mediated down-regulation of CcnA2 and Cdk2 expression at both the transcriptional and post-transcriptional level in HSC-2 cells but not in Ca9-22 cells. RNAi-mediated knockdown of CcnA2 and Cdk2 resulted in growth inhibition in both cell lines. These results indicate that the resistance of OSCC to IFNgamma is not due simply to the deficiency in STAT1-dependent signaling but results from a defect in the signaling component that mediates this IFNgamma-induced down-regulation of CcnA2 and Cdk2 expression at the transcriptional and post-transcriptional levels.


Figures

FIGURE 1.
FIGURE 1.
Effect of IFNγ on the growth of human oral squamous cell carcinoma lines. A, OSCC cell lines were seeded in 96-well plates and incubated for 20 h followed by treatment with or without various concentrations of IFNγ for 96 h. Cell proliferation was determined using a cell counting kit, as described under “Experimental Procedures.” Each column and bar represents the mean ± S.E. of four independent experiments. B, cells were seeded in a 6-cm dish and incubated for 20 h before stimulation with IFNγ (10 ng/ml). After cultivation with or without IFNγ (untreated (UT)) for the indicated time periods, cell numbers were determined using a hemocytometer. Data correspond to the mean ± S.E. of four independent experiments.
FIGURE 2.
FIGURE 2.
IFNγ-induced STAT1-dependent transcriptional activity is intact in the OSCC lines. A, levels of STAT1 phosphorylation on tyrosine 701 in IFNγ-stimulated OSCC cells. Cells were stimulated with IFNγ (10 ng/ml) for 1 h before the preparation of total cell lysates. The lysates were subjected to electrophoresis (20 μg per lane) followed by Western blotting with the indicated antibodies. B, DNA binding activity of STAT1 in nuclear extracts from IFNγ-stimulated cells. The cells were treated with IFNγ (10 ng/ml) for 1 h before the preparation of nuclear extracts. Samples (10 μg) of each nuclear extract were analyzed for GAS binding activity by electrophoretic mobility shift assay. Super-shifted complexes containing the anti-STAT1 antibody are shown. Similar results were obtained in three separate experiments. C and D, STAT1-dependent transcriptional activities in IFNγ-stimulated OSCC lines. The cells were transiently transfected with the indicated luciferase reporter construct. Twenty-four hour after transfection, the cells were either left untreated (UT) or were treated with IFNγ (10 ng/ml) for 8 h, after which luciferase activity was measured. The relative luciferase activity is shown as a percentage of the activity from pCMVluc-transfected cells. Each column and bar represents the mean ± S.E. of three independent experiments.
FIGURE 3.
FIGURE 3.
Effect of IFNγ on the proportions of HSC-2 and Ca9–22 cells at different stages of the cell cycle. A, asynchronously growing HSC-2 or Ca9–22 cells were treated with or without IFNγ (10 ng/ml) for the indicated time periods. The cells were then harvested, and flow cytometric analysis for DNA content was performed, as described under “Experimental Procedures.” Flow cytometric data were analyzed using WinCycle software to determine the proportion of cells in each stage of the cell cycle. Data shown are the means ± S.E. of 8–11 independent experiments. Asterisks denote a statistically significant difference from untreated (UT) cultures (*, p < 0.05, Student's t test). B, inhibition of DNA synthesis in IFNγ-treated HSC-2 cells. The cells were cultured in the presence or absence of IFNγ (10 ng/ml) for the indicated time periods, and the rate of DNA synthesis was determined by pulse labeling with [3H]thymidine for the last hour of incubation. Each column and bar represents the mean ± S.E. of three independent experiments.
FIGURE 4.
FIGURE 4.
IFNγ inhibits CcnA2-associated Cdk activity and down-regulates CcnA2 and Cdk2 protein expression in HSC-2 cells. A, CcnA2-associated Cdk activity in HSC-2 and Ca9–22 cells. Cells were treated with or without IFNγ (10 ng/ml) for the indicated time periods, after which total cell lysates were prepared. CcnA2 was immunoprecipitated from the lysate with anti-CcnA2 antibody, and CcnA2-associated Cdk activity was assayed by the in vitro kinase assay using histone H1 as substrate. Input histone H1 was assessed by Western blotting. B, effect of IFNγ on p21WAF-1/CIP1 protein expression in HSC-2 and Ca9–22 cells. Cells were either left untreated or were treated with IFNγ (10 ng/ml) for the indicated time periods before total cell extracts were prepared. Equal amounts of cellular protein (40 μg/lane) were loaded on the gel and analyzed by Western blotting using the indicated antibodies. Lysate from HEK293 cells transfected with the expression plasmid encoding human p21 cDNA (a kind gift from Dr. Bert Vogelstein, The Johns Hopkins Oncology Center) was used as a positive control for p21 protein (lane 1). C, Western blotting analysis of CcnA2 and Cdk2 expression levels in IFNγ-treated OSCC lines. Cells were either left untreated or treated with IFNγ for the indicated time periods, as described above. Equal amounts of cellular protein (40 μg/lane) were loaded in the gel and analyzed by Western blotting using the indicated antibodies. Similar results were obtained in three separate experiments.
FIGURE 5.
FIGURE 5.
Effect of IFNγ on cyclin D and Cdk protein expression levels in HSC-2 and Ca9–22 cells. Cells were either left untreated or were treated with IFNγ (10 ng/ml) for the indicated time periods, as described in the legend for Fig. 4. Equal amounts of cellular protein (40 μg/lane) were loaded in the gel and analyzed by Western blotting using the indicated antibodies. Similar results were obtained in three separate experiments.
FIGURE 6.
FIGURE 6.
CcnA2 and Cdk2 are required for the growth of HSC-2 and Ca9–22 cells. Cells were transfected with siRNA as described under “Experimental Procedures.” siRNA-green fluorescent protein (GFP) was used as a negative control. After 48 h of transfection, total cellular lysates were prepared and subjected to electrophoresis followed by Western blotting with the indicated antibodies (A and C). The cells transfected with siRNA were re-seeded at a density of 2 × 10³ cells in 96-well plates and cultured for the indicated times (B and D). Cell proliferation was determined using a cell counting kit, as described under “Experimental Procedures.” The data shown are the means ± S.E. of quadruplicate determinations from a representative experiment that was repeated three times with similar results. Asterisks denote a statistically significant difference compared with cultures with siRNA-green fluorescent protein (*, p < 0.05; **, p < 0.01, Student's t test). UT, untreated.
FIGURE 7.
FIGURE 7.
IFNγ down-regulates CcnA2 and Cdk2 mRNA in HSC-2 cells. A, HSC-2 or Ca9–22 cells were either left untreated or were treated with IFNγ (10 ng/ml) for the indicated time periods before preparation of total RNA and analysis of specific mRNA levels by northern hybridization. A sample (10 μg) of each total RNA was analyzed in each lane. B, Northern blots were quantified by phosphorimaging analysis, and relative mRNA levels for CcnA2 or Cdk2 are presented as a percentage of the expression in untreated cells cultured for 12 h. The data shown represent the means ± S.E. of three independent experiments. Asterisks denote a statistically significant difference compared with the untreated cultures (*, p < 0.05; **, p < 0.01, Student's t test). C, qRT-PCR analysis of c-myc mRNA expression in HSC-2 and Ca9–22 cells treated with IFNγ. Total RNA was prepared as described above and was used for qRT-PCR analysis of c-myc mRNA. The levels of c-myc mRNA are expressed as the percentage of the levels obtained at day 0 and were normalized to those of the 18 S rRNA used as an internal control. The data shown represent means ± S.E. of three independent experiments. UT, untreated.
FIGURE 8.
FIGURE 8.
IFNγ down-regulates CcnA2 and Cdk2 promoter activities in HSC-2 cells. HSC-2 or Ca9–22 cells were transiently transfected with the indicated CcnA2 (A), Cdk2 (B), or c-myc (C) luciferase reporter constructs. At 24 h after transfection the cells were either left untreated (UT) or were treated with IFNγ (10 ng/ml) for 24 h before measuring luciferase activity. The relative luciferase activity is shown as a percentage of the activity in untreated cells, and the percentage of inhibition by IFNγ is indicated above the column. Each column and bar represents the mean ± S.E. of three independent experiments.
FIGURE 9.
FIGURE 9.
IFNγ destabilizes CcnA2 and Cdk2 mRNA in HSC-2 cells. A, HSC-2 or Ca9–22 cells were either left untreated (control) or were treated with IFNγ for 24 h. Each culture was subsequently treated with actinomycin D (ActD, 5 mg/ml), and the incubation was continued for the indicated times. Untreated cultures were harvested before ActD treatment and are designated as time 0. Total RNA was prepared, and 10 μg of each sample was analyzed for specific mRNA levels by northern hybridization. B, Northern blots were quantified by phosphorimaging analysis, and the relative amounts of residual mRNA encoding CcnA2 or Cdk2 were calculated. Data shown represent the means ± S.E. of three independent experiments. C, qRT-PCR analysis of c-myc mRNA stability in HSC-2 and Ca9–22 cells treated with IFNγ. Total RNA was prepared as described above and was used for qRT-PCR analysis of c-myc mRNA. The levels of c-myc mRNA are expressed as the percentage of the levels at time 0 and were normalized to those of the 18 S rRNA used as an internal control. The data shown represent the means ± S.E. of three independent experiments. The half-lives of the mRNAs (t½) are shown.

Similar articles

Cited by

References

    1. Pestka S., Langer J. A., Zoon K. C., Samuel C. E. (1987) Annu. Rev. Biochem. 56, 727–777 - PubMed
    1. Boehm U., Klamp T., Groot M., Howard J. C. (1997) Annu. Rev. Immunol. 15, 749–795 - PubMed
    1. Chin Y. E., Kitagawa M., Su W. C., You Z. H., Iwamoto Y., Fu X. Y. (1996) Science 272, 719–722 - PubMed
    1. Sangfelt O., Erickson S., Einhorn S., Grandér D. (1997) Oncogene 14, 415–423 - PubMed
    1. Mandal M., Bandyopadhyay D., Goepfert T. M., Kumar R. (1998) Oncogene 16, 217–225 - PubMed

Publication types