. 2009 Sep 18;284(38):25823-31.
doi: 10.1074/jbc.M109.031013. Epub 2009 Jul 13.

Mutation of asparagine 76 in the center of glutamine transporter SNAT3 modulates substrate-induced conductances and Na+ binding

Affiliations

Mutation of asparagine 76 in the center of glutamine transporter SNAT3 modulates substrate-induced conductances and Na+ binding

Stefan Bröer et al. J Biol Chem. .

Abstract

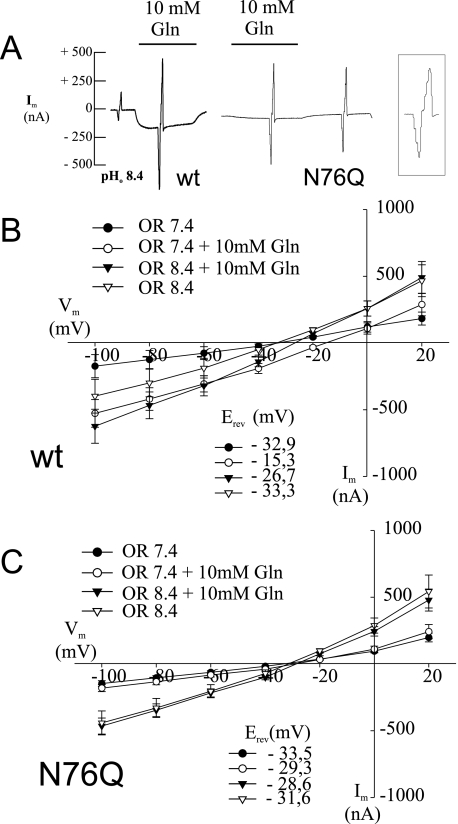
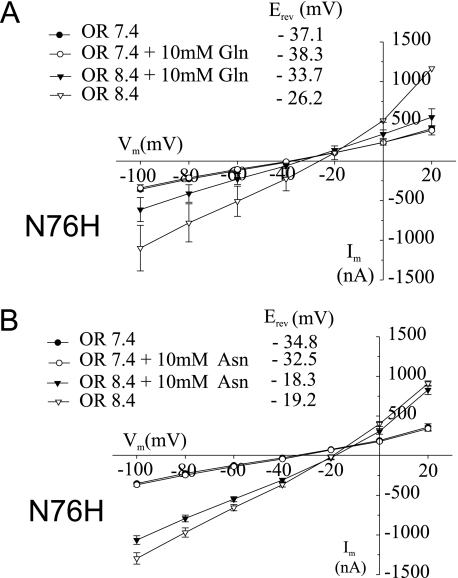
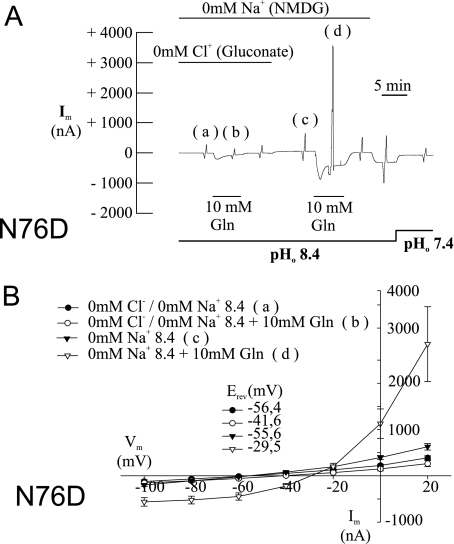
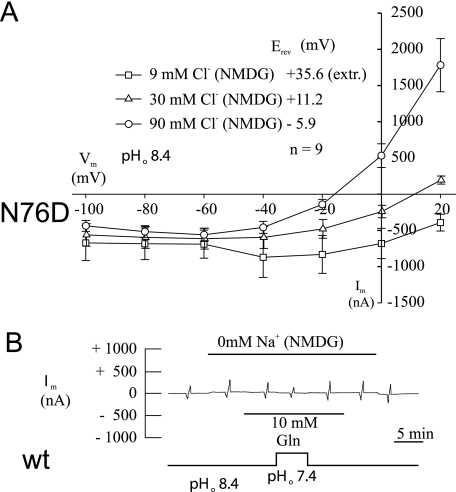
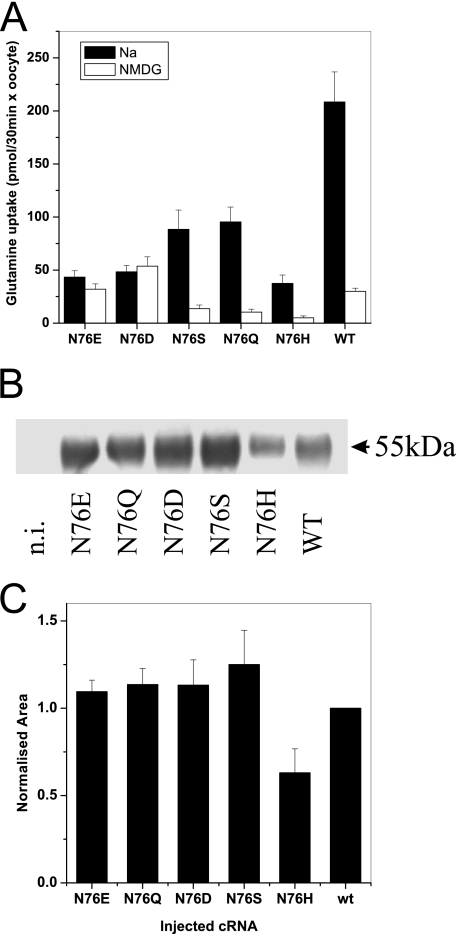
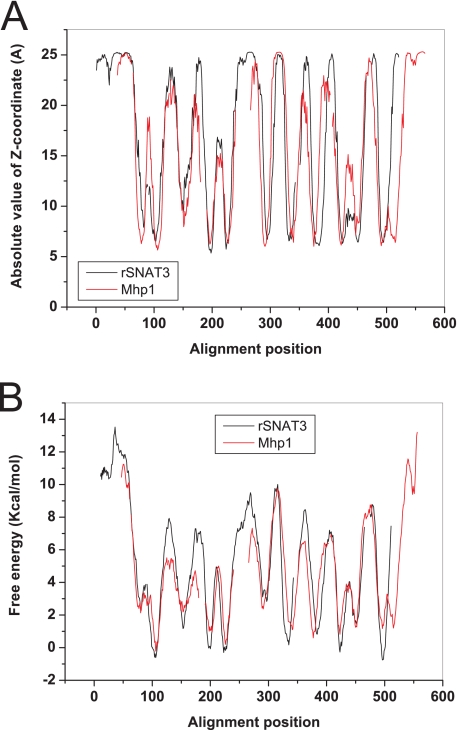
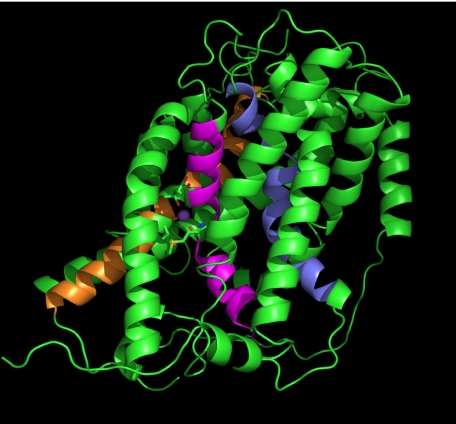
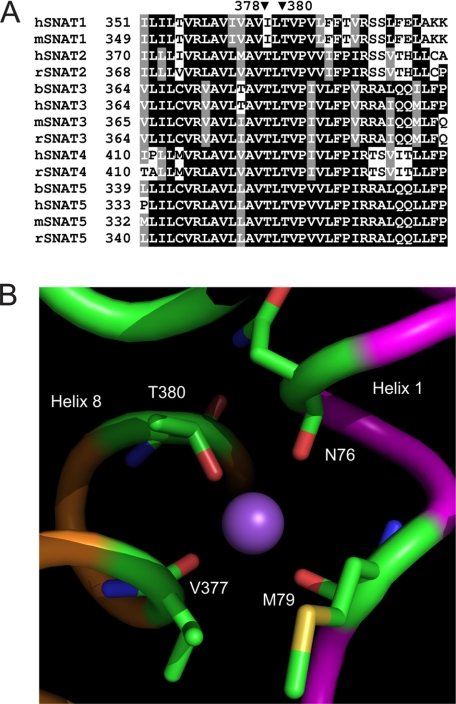
The glutamine transporter SLC38A3 (SNAT3) plays an important role in the release of glutamine from brain astrocytes and the uptake of glutamine into hepatocytes. It is related to the vesicular GABA (gamma-aminobutyric acid) transporter and the SLC36 family of proton-amino acid cotransporters. The transporter carries out electroneutral Na+-glutamine cotransport-H+ antiport. In addition, substrate-induced uncoupled cation currents are observed. Mutation of asparagine 76 to glutamine or histidine in predicted transmembrane helix 1 abolished all substrate-induced currents. Mutation of asparagine 76 to aspartate rendered the transporter Na+-independent and resulted in a gain of a large substrate-induced chloride conductance in the absence of Na+. Thus, a single residue is critical for coupled and uncoupled ion flows in the glutamine transporter SNAT3. Homology modeling of SNAT3 along the structure of the related benzyl-hydantoin permease from Microbacterium liquefaciens reveals that Asn-76 is likely to be located in the center of the membrane close to the translocation pore and forms part of the predicted Na+ -binding site.


Figures

FIGURE 1.
FIGURE 1.
Glutamine-induced currents in SNAT3 and its mutant N76Q. Oocytes were injected with 20 ng of cRNA encoding SNAT3 or its mutant N76Q, and glutamine-induced (10 mm) currents were analyzed after 3–6 days of expression at pH 7.4 or pH 8.4 (as indicated). Conductance and current-voltage relationships were measured by applying voltage jumps in increments of 20 mV from −100 mV to +20 mV at different stages of the recording; in the intervening periods oocytes were held at −40 mV. The responses to the voltage jumps generate the spikes in the recordings (shown on an extended time scale in the boxed tracing). The size of the spikes is proportional to the size of the conductance. Typical recordings at pH 8.4 are depicted from oocytes expressing wild type (wt) SNAT3 and its mutant N76Q (A). Current-voltage relationships for SNAT3 and the N76Q mutant were derived from the responses to the voltage jumps and are depicted in (wild type, n = 8) (B) and (N76Q, n = 6) (C), respectively. OR, oocyte ringer.
FIGURE 2.
FIGURE 2.
Glutamine-induced currents in SNAT3 mutant N76H. Oocytes were injected with 20 ng of cRNA encoding SNAT3 mutant N76H, and glutamine-induced (10 mm) or asparagine-induced (10 mm) currents were analyzed after 4–5 days of expression at pH 7.4 and 8.4. Current-voltage relationships are depicted for glutamine-induced currents (A, n = 8) and asparagine-induced currents (B, n = 3). OR, oocyte ringer.
FIGURE 3.
FIGURE 3.
Glutamine-induced currents in SNAT3 mutant N76D. Oocytes were injected with 20 ng of cRNA encoding SNAT3 mutant N76D, and glutamine-induced (10 mm) currents were analyzed after 3–6 days of expression at pH 7.4 and pH 8.4 and under different ionic conditions as indicated. Sodium ions were replaced by NMDG+, and chloride ions were replaced by gluconate. Typical recordings are depicted from oocytes expressing SNAT3 mutant N76D (A); the corresponding current-voltage relationship for SNAT3 mutant N76D is depicted in B (n = 8). The responses to voltage jumps (A) at the indicated positions (a, b, c, and d) were converted into I/V plots (B) and labeled accordingly. NMDG, N-methyl-d-glucamine.
FIGURE 4.
FIGURE 4.
Reversal potential of glutamine-induced currents in SNAT3 mutant N76D. Oocytes were injected with 20 ng of cRNA encoding SNAT3 or its mutant N76D, and glutamine-induced (10 mm) currents were analyzed after 3–6 days of expression at pH 7.4 and 8.4. The reversal potential was recorded at three different chloride concentrations (A). The reversal potential at 9 mm chloride was extrapolated (extr.); chloride ions were replaced by gluconate ions. Wild type (wt) SNAT3 expressing oocytes did not show glutamine-induced currents in the absence of Na+ as shown in a typical recording (B). NMDG, N-methyl-d-glucamine.
FIGURE 5.
FIGURE 5.
Transport activity and surface expression of oocytes expressing SNAT3 and its mutants. Oocytes were injected with 20 ng of cRNA encoding SNAT3 or its mutants. After 5 days of expression, uptake of [14C]glutamine was measured over an incubation period of 30 min, pH 8.4. The mean ± S.D. activity of 10 oocytes was determined in the presence (black bars) and absence (open bars) of Na+ (A). The experiment was repeated three times with similar results. Surface proteins in oocytes of the same batch were biotinylated, and membrane proteins were isolated by binding to streptavidin-coated agarose particles. Surface expression of SNAT3 and its mutants was subsequently determined by Western blotting (B). The complete series of Western blots was quantitatively evaluated (C; n = 3). n.i., non-injected oocytes. WT, wild type; NMDG, N-methyl-d-glucamine.
FIGURE 6.
FIGURE 6.
SNAT3 is structurally related to Mhp1. The peptide sequence of rat SNAT3 (red) and of the hydantoin permease Mhp1 (black) were both analyzed using the Topcons topology prediction program. Subsequently, the absolute value of the Z-coordinate (A) and the free energy of insertion into the Sec61 translocon (B) were aligned according to the profile alignment as provided by the HHpred server. The optimally aligned sequence (supplemental Fig. 1) was then used to build a homology model along the structure of the hydantoin permease.
FIGURE 7.
FIGURE 7.
Homology model of SNAT3. The homology model was generated using Modeler with the optimized alignment between Mhp1 and rSNAT3 (supplemental Fig. 1). The structure was visualized using PyMol (DeLano Scientific). Helix 1 is shown in purple, helix 6 is in blue, and helix 8 is in orange.
FIGURE 8.
FIGURE 8.
Sequence alignment of members of the SNAT (SLC38) family and putative SNAT3 Na+-binding site. A, reference sequences for SNAT1–5 were downloaded and aligned using ClustalW. The alignment around rat SNAT3 residue Thr-380 is shown. The corresponding positions in other family members are indicated. Human, mouse, rat, and bovine sequences are indicated by prefix h, m, r, and b, respectively. B, close view of the proposed Na+-binding site of SNAT3. Helix 1 is shown in purple, and helix 8 is in orange. Residues potentially involved in Na+ binding are indicated.

References

    1. Sundberg B. E., Wååg E., Jacobsson J. A., Stephansson O., Rumaks J., Svirskis S., Alsiö J., Roman E., Ebendal T., Klusa V., Fredriksson R. (2008) J. Mol. Neurosci. 35, 179–193 - PubMed
    1. Gasnier B. (2004) Pflugers Arch. 447, 756–759 - PubMed
    1. Boll M., Daniel H., Gasnier B. (2004) Pflugers Arch. 447, 776–779 - PubMed
    1. Bröer S., Bailey C. G., Kowalczuk S., Ng C., Vanslambrouck J. M., Rodgers H., Auray-Blais C., Cavanaugh J. A., Bröer A., Rasko J. E. (2008) J. Clin. Invest. 118, 3881–3892 - PMC - PubMed
    1. Mackenzie B., Erickson J. D. (2004) Pflugers Arch. 447, 784–795 - PubMed

Publication types

MeSH terms

LinkOut - more resources