

Microarray analysis of lymphatic tissue reveals stage-specific, gene expression signatures in HIV-1 infection
- PMID: 19596987
- PMCID: PMC3552354
- DOI: 10.4049/jimmunol.0803222
Microarray analysis of lymphatic tissue reveals stage-specific, gene expression signatures in HIV-1 infection
Abstract
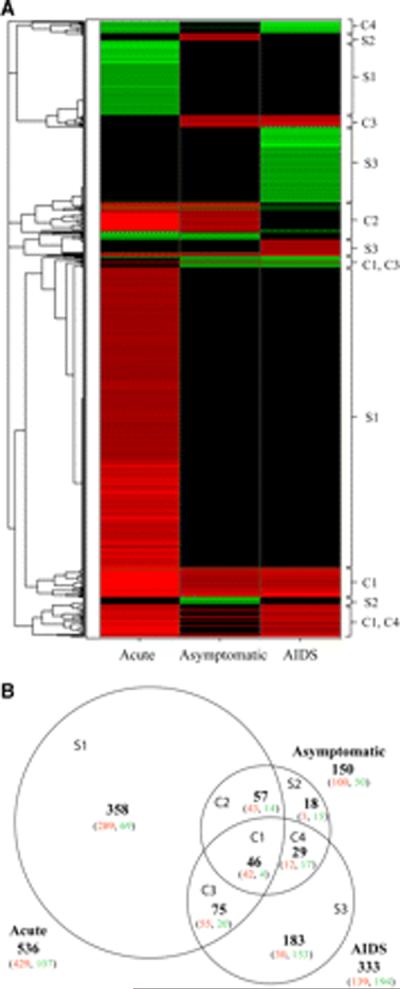
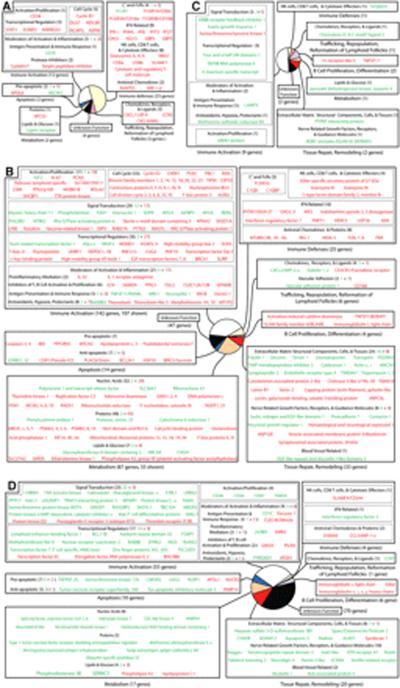
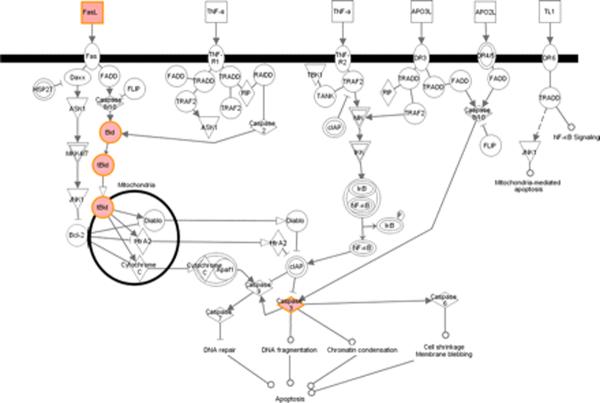
Untreated HIV-1 infection progresses through acute and asymptomatic stages to AIDS. Although each of the three stages has well-known clinical, virologic, and immunologic characteristics, much less is known of the molecular mechanisms underlying each stage. In this study, we report lymphatic tissue microarray analyses, revealing for the first time stage-specific patterns of gene expression during HIV-1 infection. We show that although there is a common set of key genes with altered expression throughout all stages, each stage has a unique gene expression signature. The acute stage is most notably characterized by increased expression of hundreds of genes involved in immune activation, innate immune defenses (e.g., RIG-1, MDA-5, TLR7 and TLR8, PKR, APOBEC3B, 3F, 3G), adaptive immunity, and in the proapoptotic Fas-Fas ligand pathway. Yet, quite strikingly, the expression of nearly all acute stage genes return to baseline levels in the asymptomatic stage, accompanying partial control of infection. This transition from acute to asymptomatic stage is tied to increased expression of a diverse array of immunosuppressive genes (e.g., CLEC12B, ILT4, galectin-3, CD160, BCMA, FGL2, LAG3, GPNMB). In the AIDS stage, decreased expression of numerous genes involved in T cell signaling identifies genes contributing to T cell dysfunction. These common and stage-specific gene expression signatures identify potential molecular mechanisms underlying the host response and the slow, natural course of HIV-1 infection.
Figures
Similar articles
-
Gene expression profiling of host response in models of acute HIV infection.J Immunol. 2004 Dec 1;173(11):6858-63. doi: 10.4049/jimmunol.173.11.6858. J Immunol. 2004. PMID: 15557180
-
Functional genomic analysis of the response of HIV-1-infected lymphatic tissue to antiretroviral therapy.J Infect Dis. 2004 Feb 15;189(4):572-82. doi: 10.1086/381396. Epub 2004 Feb 5. J Infect Dis. 2004. PMID: 14767808
-
Differentially co-expressed interacting protein pairs discriminate samples under distinct stages of HIV type 1 infection.BMC Syst Biol. 2011;5 Suppl 2(Suppl 2):S1. doi: 10.1186/1752-0509-5-S2-S1. Epub 2011 Dec 14. BMC Syst Biol. 2011. PMID: 22784566 Free PMC article.
-
Tissue lesions in AIDS patients involve both the lymphoid and the nervous system.AIDS. 1995;9 Suppl A:S41-8. AIDS. 1995. PMID: 8819568 Review. No abstract available.
-
Population biology of HIV-1 infection: viral and CD4+ T cell demographics and dynamics in lymphatic tissues.Annu Rev Immunol. 1999;17:625-56. doi: 10.1146/annurev.immunol.17.1.625. Annu Rev Immunol. 1999. PMID: 10358770 Review.
Cited by
-
Human immunodeficiency virus-1 Tat activates NF-κB via physical interaction with IκB-α and p65.Nucleic Acids Res. 2012 Apr;40(8):3548-62. doi: 10.1093/nar/gkr1224. Epub 2011 Dec 19. Nucleic Acids Res. 2012. PMID: 22187158 Free PMC article.
-
Nonpathogenesis of simian immunodeficiency virus infection is associated with reduced inflammation and recruitment of plasmacytoid dendritic cells to lymph nodes, not to lack of an interferon type I response, during the acute phase.J Virol. 2010 Feb;84(4):1838-46. doi: 10.1128/JVI.01496-09. Epub 2009 Nov 25. J Virol. 2010. PMID: 19939930 Free PMC article.
-
Gene dysregulation in acute HIV-1 infection - early transcriptomic analysis reveals the crucial biological functions affected.Front Cell Infect Microbiol. 2023 Apr 3;13:1074847. doi: 10.3389/fcimb.2023.1074847. eCollection 2023. Front Cell Infect Microbiol. 2023. PMID: 37077524 Free PMC article.
-
The immunosuppressive role of IL-32 in lymphatic tissue during HIV-1 infection.J Immunol. 2011 Jun 1;186(11):6576-84. doi: 10.4049/jimmunol.1100277. Epub 2011 Apr 27. J Immunol. 2011. PMID: 21525393 Free PMC article.
-
Fibrinogen-Like Protein 2 (FGL2) is a Novel Biomarker for Clinical Prediction of Human Breast Cancer.Med Sci Monit. 2020 Jul 27;26:e923531. doi: 10.12659/MSM.923531. Med Sci Monit. 2020. PMID: 32716910 Free PMC article.
References
-
- Li Q, Duan L, Estes JD, Ma ZM, Rourke T, Wang Y, Reilly C, Carlis J, Miller CJ, Haase AT. Peak SIV replication in resting memory CD4+ T cells depletes gut lamina propria CD4+ T cells. Nature. 2005;434:1148–1152. - PubMed
-
- Mattapallil JJ, Douek DC, Hill B, Nishimura Y, Martin M, Roederer M. Massive infection and loss of memory CD4+ T cells in multiple tissues during acute SIV infection. Nature. 2005;434:1093–1097. - PubMed
-
- Fauci AS. Host factors and the pathogenesis of HIV-induced disease. Nature. 1996;384:529–534. - PubMed
-
- Giri MS, Nebozhyn M, Showe S, Montaner LJ. Microarray data on gene modulation by HIV-1 in immune cells: 2000–2006. J. Leukocyte Biol. 2006;80:1031–1043. - PubMed
-
- Hyrcza MD, Kovacs C, Loutfy M, Halpenny R, Heisler L, Yang S, Wilkins O, Ostrowski M, Der SD. Distinct transcriptional profiles in ex vivo CD4+ and CD8+ T cells are established early in human immunodeficiency virus type 1 infection and are characterized by a chronic interferon response as well as extensive transcriptional changes in CD8+ T cells. J. Virol. 2007;81:3477–3486. - PMC - PubMed
Publication types
MeSH terms
Substances
Grants and funding
LinkOut - more resources
Full Text Sources
Other Literature Sources
Medical
Molecular Biology Databases
Research Materials
Miscellaneous
