. 2009 Jul 28;106(30):12518-23.
doi: 10.1073/pnas.0903214106. Epub 2009 Jul 13.

A basal ganglia-forebrain circuit in the songbird biases motor output to avoid vocal errors

Affiliations

A basal ganglia-forebrain circuit in the songbird biases motor output to avoid vocal errors

Aaron S Andalman et al. Proc Natl Acad Sci U S A. .

Abstract

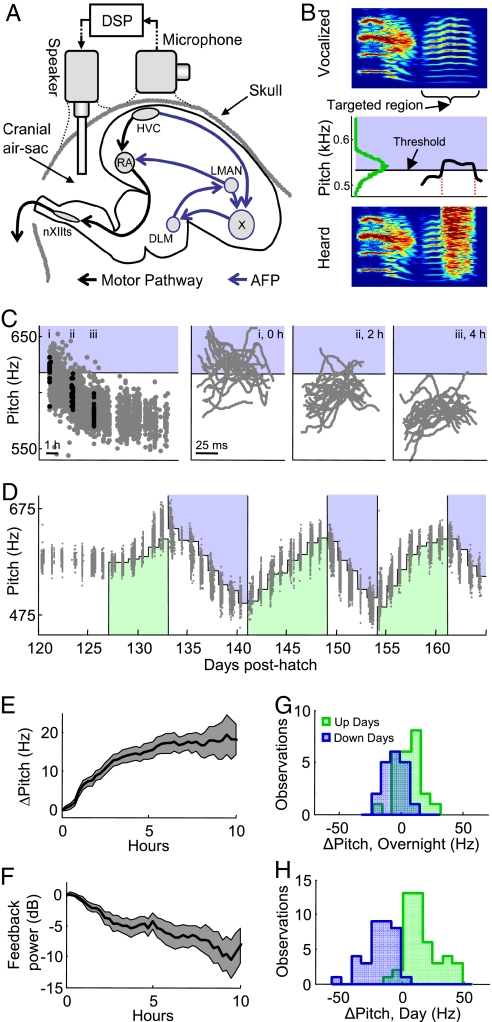
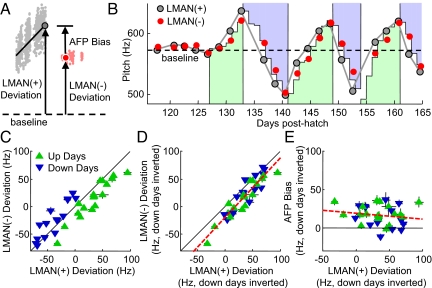
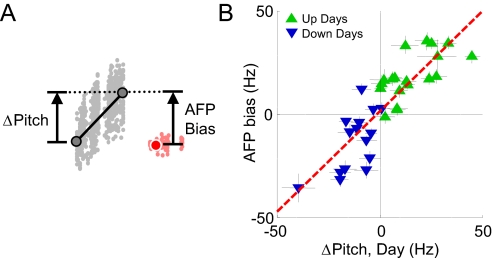
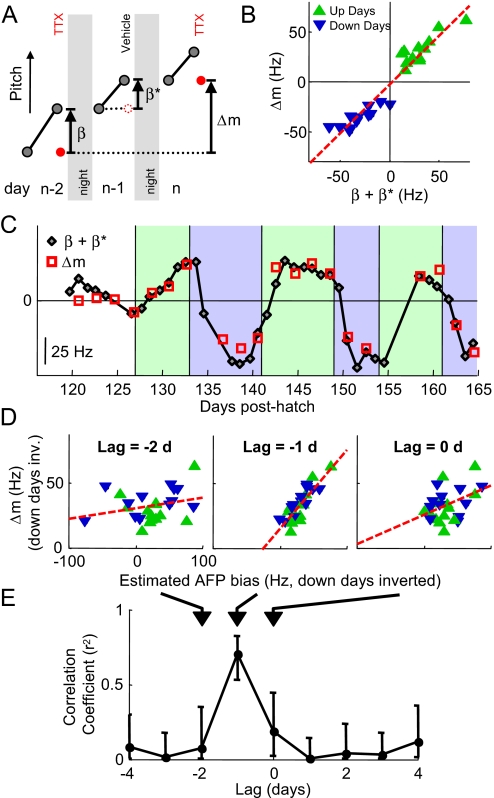
In songbirds, as in mammals, basal ganglia-forebrain circuits are necessary for the learning and production of complex motor behaviors; however, the precise role of these circuits remains unknown. It has recently been shown that a basal ganglia-forebrain circuit in the songbird, which projects directly to vocal-motor circuitry, has a premotor function driving exploration necessary for vocal learning. It has also been hypothesized that this circuit, known as the anterior forebrain pathway (AFP), may generate an instructive signal that improves performance in the motor pathway. Here, we show that the output of the AFP directly implements a motor correction that reduces vocal errors. We use disruptive auditory feedback, contingent on song pitch, to induce learned changes in song structure over the course of hours and find that reversible inactivation of the output of the AFP produces an immediate regression of these learned changes. Thus, the AFP is involved in generating an error-reducing bias, which could increase the efficiency of vocal exploration and instruct synaptic changes in the motor pathway. We also find that learned changes in the song generated by the AFP are incorporated into the motor pathway within 1 day. Our observations support a view that basal ganglia-related circuits directly implement behavioral adaptations that minimize errors and subsequently stabilize these adaptations by training premotor cortical areas.


Conflict of interest statement

The authors declare no conflict of interest.

Figures

Fig. 1.
Fig. 1.
Conditional feedback induces learning. (A) Schematic showing selected nuclei in the songbird brain and experimental apparatus to deliver conditional feedback. Vocal motor pathway (black arrows) and the anterior forebrain pathway, a basal ganglia-forebrain circuit necessary for learning (blue arrows, AFP). To induce learning, disruptive auditory feedback is played to the bird via a speaker implanted in the cranial airsac that is internally continuous with the eardrum. Feedback signals are computed with <4-ms delay by a digital signal processor (DSP), based on acoustic signals measured by a microphone on the head. HVC, proper name; RA, robust nucleus of the arcopallium; LMAN, lateral magnocellular nucleus of the nidopallium; X, Area X (proper name, homologous to the basal ganglia); DLM, dorsolateral nucleus of the medial thalamus; nXIIts, nucleus of the 12th nerve. (B) Schematic of conditional feedback protocol. Spectrogram of targeted syllable (Top), total duration 180 ms. A measure of pitch is computed continuously (Middle, black curve). Whenever the pitch falls above a threshold (blue region) white noise is played to the bird (Bottom). The threshold is positioned in the center of the pitch distribution of the targeted region (green curve). (C) (Left) The average pitch (gray dots) of each rendition of the targeted harmonic stack sung over the course of the day, and the range of pitches for which feedback was played (blue region). (Right) The pitch time course within the targeted harmonic stack for 20 consecutive renditions (black dots in Left) at 3 time points during learning. (D) Average pitch of each rendition of the targeted syllable (gray dots) for 1 experimental bird, plotted as a function of time (shading demarcates pitches that result in feedback; green, up days; blue, down days). (E) Average time course of pitch changes, relative to initial morning value, during a day of exposure to conditional feedback (down days inverted). Shaded area indicates SEM. (F) Average time course of feedback noise power relative to initial morning value. (G) Histogram of the overnight change in pitch. (H) Histogram of learned pitch changes during each day of feedback.
Fig. 2.
Fig. 2.
LMAN inactivation reveals a contribution of the AFP to vocal learning. (A) Reverse microdialysis probes are implanted bilaterally into LMAN, and tetrodotoxin (TTX) solution is held in a reservoir and diffuses through a porous membrane. (B) Average pitch (Upper) of each rendition of the targeted syllable during a day on which TTX was infused into LMAN (gray dots, pre-TTX; red dots, post-TTX). (Lower) The feedback power played during the targeted syllable (dots represent averages of 10 sequential renditions). Black dots indicate the mean pitch in the morning, preinfusion, and postinfusion. (C) Same as B except vehicle was infused (purple dots). Note that during vehicle infusions the pitch of the targeted syllables continued to exhibit learning in the instructed direction (1.26 ± 0.66Hz/hr, P < 0.03, 2-tailed t test), whereas learning stopped during TTX infusions (−0.50 ± 0.62 Hz/hr, P > 0.7, 2-tailed t test). (D) Feedback noise power, preinfusion versus postinfusion (TTX, red hollow symbols; vehicle, purple filled symbols). Black line indicates unity slope. (E) Histogram of the effect of TTX infusion on pitch (postinfusion minus preinfusion). Note the regression of pitch opposite the ongoing direction of learning (green and blue, learning in upward and downward direction respectively). (F) Histogram of the effect of vehicle infusion on pitch.
Fig. 3.
Fig. 3.
The motor pathway contributes to accumulated changes in pitch. (A) Schematic showing the deviation of the preinactivation pitch [LMAN(+), large gray dot] and postinactivation pitch [LMAN(−), large red dot] from the average syllable pitch before the first exposure to conditional feedback (baseline pitch, dashed line). (B) Time series of LMAN(+) and LMAN(−) pitch for all experimental days in 1 bird. (C) Scatter plot of the deviation of LMAN(−) pitch and LMAN(+) pitch from baseline for all inactivations (error bars indicate 3 SE). (D) Same as C, but data from up and down days are combined by inverting the sign of the deviation for down days (linear regression, red dashed line; r2 = 0.85, slope = 1.08 ± 0.08. (E) Scatter plot of AFP bias versus the deviation of LMAN(+) pitch from baseline (data from down days are inverted; linear regression, red dashed line; slope not significantly different from zero, P > 0.3).
Fig. 4.
Fig. 4.
AFP bias is correlated with the amount of learning in the morning before inactivation. (A) Schematic illustrating the measurement of pitch learned during the day and AFP bias. (B) Scatter plot of the AFP bias versus amount of learning in the morning before infusion reveals strong correlation (linear regression, red dashed line; r2 = 0.73, slope = 0.98 ± 0.11).
Fig. 5.
Fig. 5.
AFP bias is predictive of subsequent plasticity in the motor pathway. (A) Motor plasticity was assessed as the difference (Δm) in LMAN(−) pitch between successive inactivations (red dots), carried out every other day. Gray dots represent morning and preinactivation syllable pitch. We examined the relation between motor plasticity and the estimated total AFP bias over a corresponding 2-day interval. The total was computed as the sum (β+β*) of the AFP bias on TTX days (β) plus the AFP bias on vehicle days (β*)—the latter estimated as the amount of learning that occurred during the day (see Fig. 4). (B) Scatter plot of motor plasticity (Δm) and estimated 2-day sum of AFP bias (β+β*; linear regression, red dashed line; slope = 0.99 ± 0.06, r2 = 0.93). (C) Time series of Δm (red squares) and a 2-day running sum of estimated AFP bias 1 day earlier (black diamonds), as shown in A. (D) Scatter plots showing the correlation between Δm versus the estimated 2-day sum of AFP bias at lags of −2, −1, and 0 days (linear regression, red dashed line; slopes = 0.08 ± 0.06, 0.61 ± 0.08, 0.23 ± 0.10 respectively; up and down days combined by inverting down days; see Fig. S7). A–C correspond to a lag of −1 day. (E) Correlation coefficients as a function of time lag (days). Errors bars are 95% confidence intervals.

References

    1. Konishi M. The role of auditory feedback in the control of vocalization in the white-crowned sparrow. Z Tierpsychol. 1965;22:770–783. - PubMed
    1. Immelmann K. In: Bird Vocalizations. Hinde RA, editor. London: Cambridge Univ Press; 1969. pp. 61–74.
    1. Tchernichovski O, Lints T, Mitra PP, Nottebohm F. Vocal imitation in zebra finches is inversely related to model abundance. Proc Natl Acad Sci USA. 1999;96:12901–12904. - PMC - PubMed
    1. Knowlton BJ, Mangels JA, Squire LR. A neostriatal habit learning system in humans. Science. 1996;273:1399–1402. - PubMed
    1. Graybiel AM. Habits, rituals, and the evaluative brain. Annu Rev Neurosci. 2008;31:359–387. - PubMed

Publication types

LinkOut - more resources