. 2009 Jul 28;106(30):12341-6.
doi: 10.1073/pnas.0903052106. Epub 2009 Jul 13.

Quantification of nano-scale intermembrane contact areas by using fluorescence resonance energy transfer

Affiliations

Quantification of nano-scale intermembrane contact areas by using fluorescence resonance energy transfer

Poul Martin Bendix et al. Proc Natl Acad Sci U S A. .

Abstract

Nanometer-scale intermembrane contact areas (CAs) formed between single small unilamellar lipid vesicles (SUVs) and planar supported lipid bilayers are quantified by measuring fluorescence resonance energy transfer (FRET) between a homogenous layer of donor fluorophores labeling the supported bilayer and acceptor fluorophores labeling the SUVs. The smallest CAs detected in our setup between biotinylated SUVs and dense monolayers of streptavidin were approximately 20 nm in radius. Deformation of SUVs is revealed by comparing the quenching of the donors to calculations of FRET between a perfectly spherical shell and a flat surface containing complementary fluorophores. These results confirmed the theoretical prediction that the degree of deformation scales with the SUV diameter. The size of the CA can be controlled experimentally by conjugating polyethylene glycol polymers to the SUV or the surface and thereby modulating the interfacial energy of adhesion. In this manner, we could achieve secure immobilization of SUVs under conditions of minimal deformation. Finally, we demonstrate that kinetic measurements of CA, at constant adhesion, can be used to record in real-time quantitative changes in the bilayer tension of a nano-scale lipid membrane system.


Conflict of interest statement

The authors declare no conflict of interest.

Figures

Fig. 1.
Fig. 1.
Measurements and calculations of the rate of energy transfer from a donor-labeled surface to an acceptor-labeled vesicle. (A) Schematic illustration of intersurface FRET within the contact region formed by an immobilized vesicle. (B) Micrograph of small vesicles, R ≈ 100 nm and FRET signatures acquired at the same location. (Upper) Exact determination of the vesicle size is obtained by calibrating the relation between intensity and the surface area of the vesicle. (Lower) A uniform background intensity originating from the donor labeled streptavidin is reduced within the contact region between vesicles and the surface. (Scale bar, 5 μm.) (C) The total transfer of energy from a single donor positioned a distance t away from a vesicle is obtained by summation of the energy transfer to all individual acceptors on the vesicle surface. An additional integration over the plane of donors gives the total transfer of energy from the surface to the vesicle. (D) Radial profiles for the FRET efficiency calculated for 3 vesicle radii, R = 50 nm (blue line), R = 200 nm (black line), and R = 500 nm (red line). (E) A surface plot of the calculated FRET efficiency for a spherical shell having radius R = 50 nm. The total FRET within the recessed region can be quantified from the integration performed in C and can be compared with experimental measurements. (Scale bar, 100 nm.)
Fig. 2.
Fig. 2.
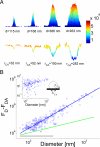
Experimental measurements of energy transfer and intermembrane CA for vesicle sizes ranging from below the optical resolution to micron-sized vesicles. (A) The top row: shows side views of several intensity peaks originating from the membrane dye in vesicles of different sizes. The integrated intensity from each vesicle is linearly proportional to the area of the bilayer containing the dye and can therefore be converted to diameter (24). Below each intensity peak is shown the reduction in donor intensity corresponding to the different vesicle sizes. The reduction in donor intensity can be used to determine the size of the CA assuming that vesicles form flat contact regions as depicted in Fig. 1A. (B) The reduction in donor intensity (FDFDA) is quantified for each vesicle (circles) and plotted versus diameter of the vesicle. Calculations of the reduced donor intensity caused by undeformed vesicles (see Fig. 1C) show a linear scaling with vesicle size (green line). The blue line is a least-square fit of the function FDFDA = cRp, with p = 2.4 ± 0.3 and c = 2.1 as fitting parameters. The reduction in donor intensity scales faster than the vesicle area (p > 2), which indicates increasing deformation for larger vesicles. (Inset) A deformation parameter is defined by α = rCA/RT, where RT is the distance from the center of the truncated vesicle to the contact line between the vesicle and the substrate, and rCA is the radius of the contact area. Quantification of vesicle size and the area of the corresponding adhesion disk is sufficient to determine α plotted as the inset graph (see SI Text for details). The black line represents the measured noise from an area corresponding to 1 airy disk with diameter 284 nm.
Fig. 3.
Fig. 3.
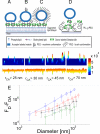
Adhesion of SUVs to a substrate is reduced in the presence of PEG polymers. (A) Vesicles containing biotinylated lipids are tethered to a streptavidin-coated supported bilayer also containing biotinylated lipids. (B) By introducing 1 mol % PEG2000 lipids, steric repulsion can reduce the deformation of the vesicle. (C) At higher concentration (5 mol %) of PEG2000 lipids, the polymers begin to overlap and extend outwards from the lipid vesicle surface to form a brush layer leading to long-range repulsion. (D) Passivation of the glass substrate with PEG2000 can effectively prevent nonspecific adhesion between the glass and the bilayer. The surface plots show examples of vesicle intensities and corresponding donor intensities in the 4 systems sketched in A–D. When no PEG2000 is present at the interface (A), a relatively large CA is formed that can be detected for vesicles having radius R ≈ 50 nm. Addition of 1 mol % PEGylated lipids to the vesicles (B) reduces the size of the adhesion disk. At 5 mol %, PEGylated lipids (C) the FRET signatures are further reduced even for larger vesicles. FRET signatures on PEGylated glass surfaces (D) were never observed for vesicles below R < 1 μm, indicating a low degree of deformation (see Figs. S6A and S7). The approximate extent of the smallest detectable contact areas, rCA, is estimated by measuring FRET per area (Fig. S1A) in the 4 systems and is given below each image. (E) Quantification of the donor reduction in the systems (A–C). The measured FRET in the absence of PEG lipids (blue squares) is higher relative to FRET measured for 1% (red circles) or 5% (black asterisk). Vesicles containing 5% PEG lipids initially show very low donor reduction (green triangles), whereas after ≈20 min, the footprints reach a steady state (black asterisk).
Fig. 4.
Fig. 4.
Adhesion kinetics of SUVs exposed to strong illumination. (A) Surface plots of FRET signatures after 1 exposure with λ = 543-nm laser on. (B) After 4 exposures, the signatures have vanished. (C) Corresponding image of the SUVs. (D) Bleaching curve of the vesicles versus number of exposures. The signal is reduced by ≈10% after 4 images, which cannot account for the disappearance of the footprints. (E) Time evolution of the tension (Cε, C = 0.01 N/m) within the bilayer for 3 different vesicles having different sizes. Experimental settings are the same as in A. The smallest vesicle becomes highly tensed after a few exposures (circles, R = 181 nm), whereas the tension in the 2 larger vesicles having similar initial tension in the bilayer evolves differently in time (diamonds R = 389 nm and squares R = 636 nm). The vesicles contain 1 mol % of PEG2000 lipids.

References

    1. Monks CRF, Freiberg BA, Kupfer H, Sciaky N, Kupfer A. Three-dimensional segregation of supramolecular activation clusters in T-cells. Nature. 1998;395:82–86. - PubMed
    1. Dustin ML, Colman DR. Neural and immunological synaptic relations. Science. 2002;298:785–789. - PubMed
    1. Rizzoli SO, Betz WJ. Synaptic vesicle pools. Nat Rev Neurosci. 2005;6:57–69. - PubMed
    1. Zenisek D, Steyer JA, Almers W. Transport, capture and exocytosis of single synaptic vesicles at active zones. Nature. 2000;406:849–854. - PubMed
    1. Parthasarathy R, Groves JT. Protein patterns at lipid bilayer junctions. Proc Natl Acad Sci USA. 2004;101:12798–12803. - PMC - PubMed

Publication types

LinkOut - more resources