. 2009 Aug;30(8):1081-91.
doi: 10.1038/aps.2009.95. Epub 2009 Jul 13.

Breviscapine ameliorates hypertrophy of cardiomyocytes induced by high glucose in diabetic rats via the PKC signaling pathway

Affiliations

Breviscapine ameliorates hypertrophy of cardiomyocytes induced by high glucose in diabetic rats via the PKC signaling pathway

Min Wang et al. Acta Pharmacol Sin. 2009 Aug.

Abstract

Aim: To investigate the influence of breviscapine on high glucose-induced hypertrophy of cardiomyocytes and the relevant mechanism in vitro and in vivo.

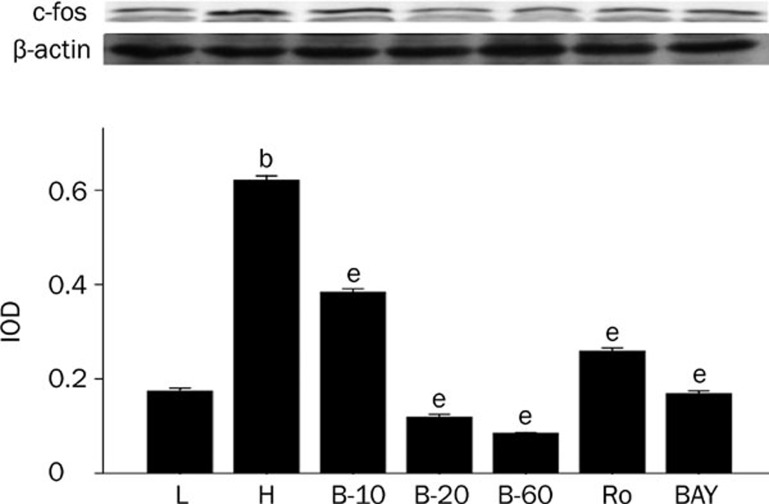
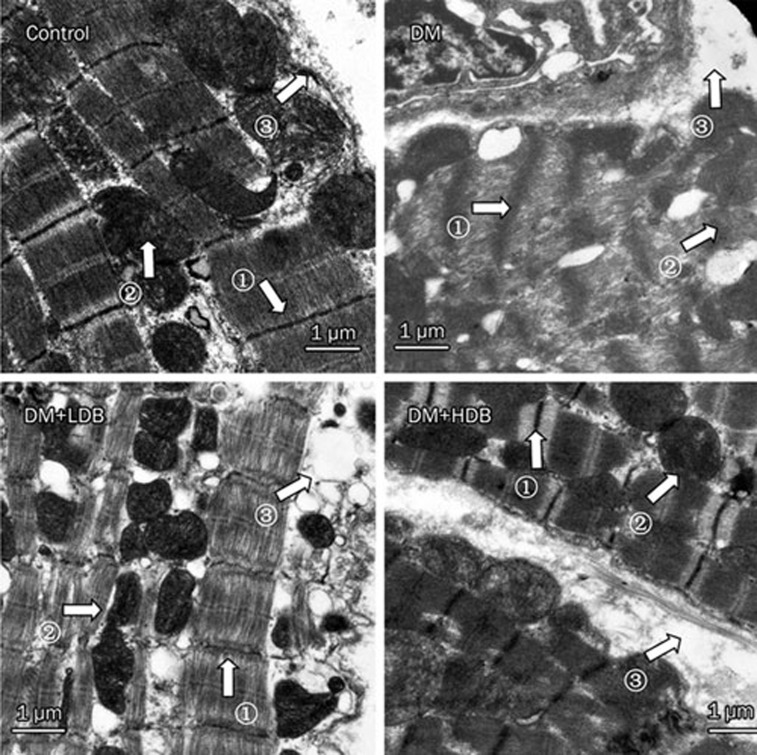
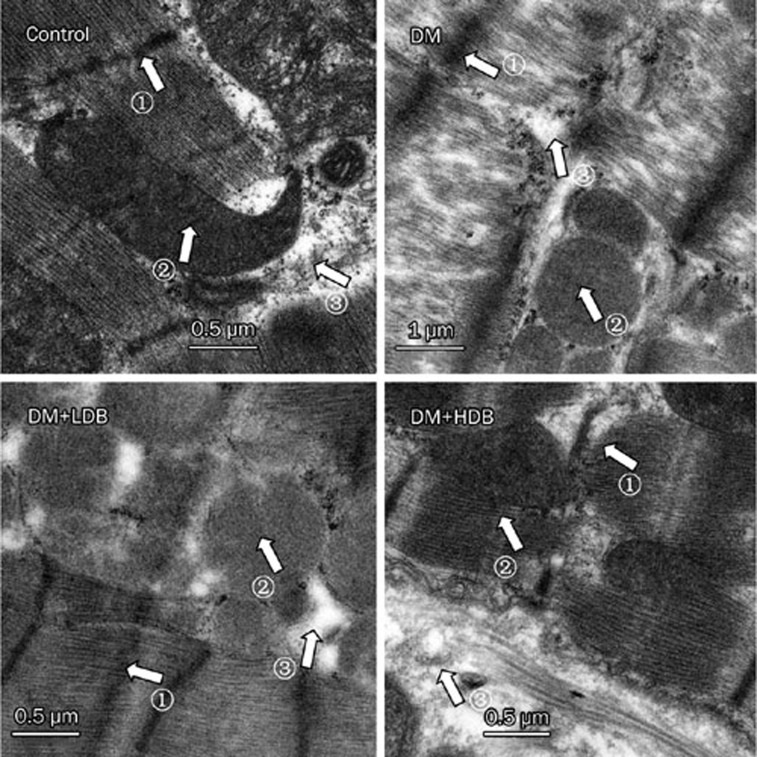
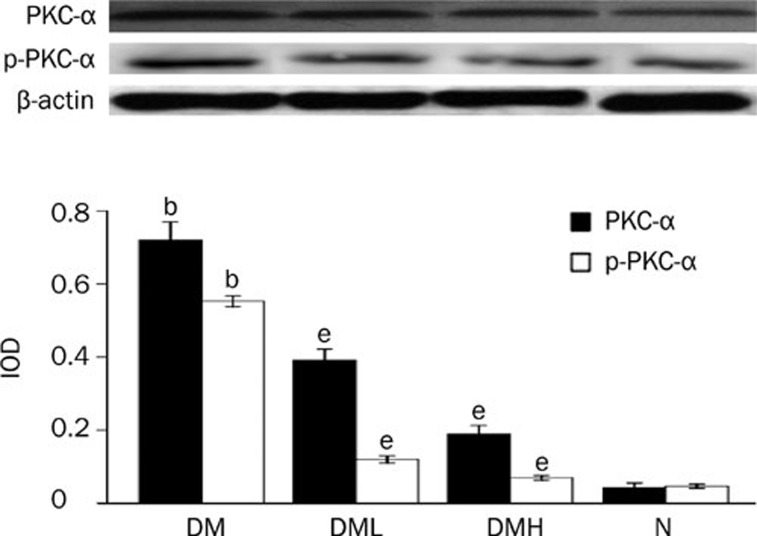
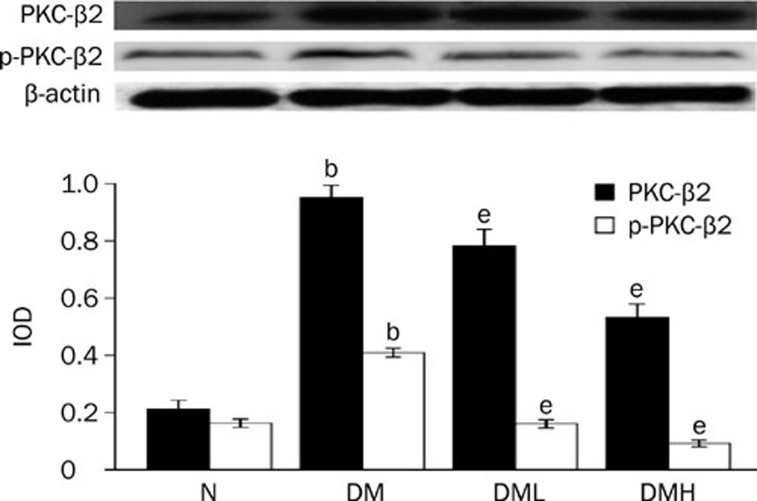
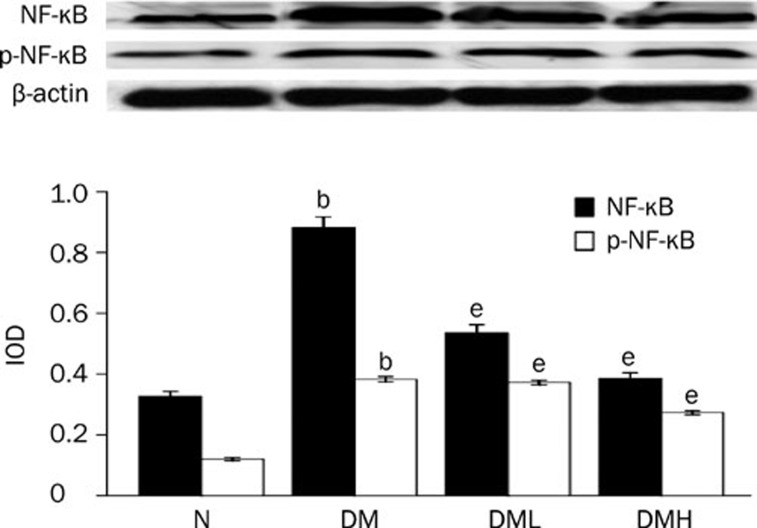
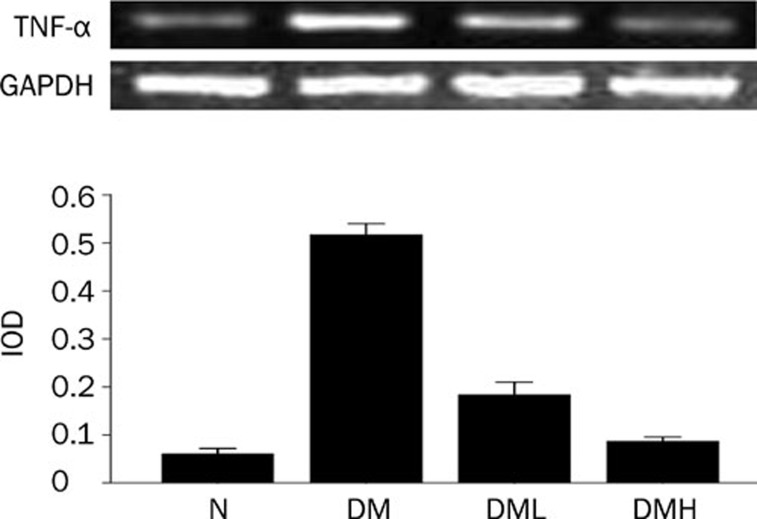
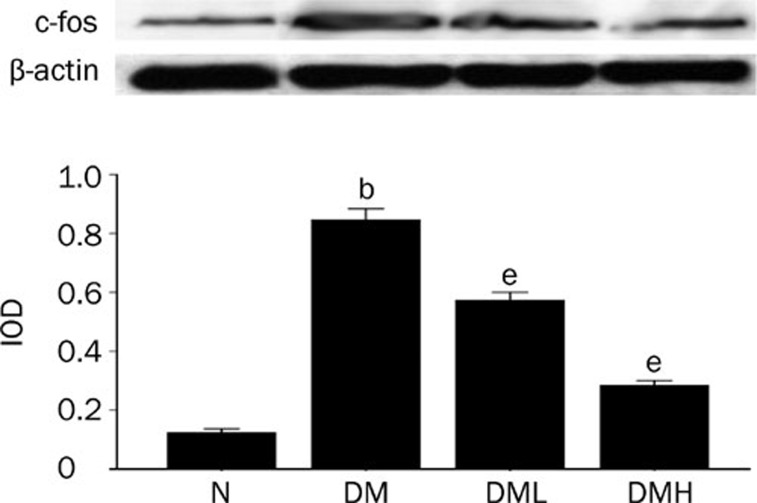
Methods: Cultured neonatal cardiomyocytes were divided into i) control; ii) high glucose concentrations; iii) high glucose+PKC inhibitor Ro-31-8220; iv) high glucose+breviscapine; or v) high glucose+NF-kappaB inhibitor BAY11-7082. Cellular contraction frequency and volumes were measured; the expression of protein kinase C (PKC), NF-kappaB, TNF-alpha, and c-fos were assessed by Western blot or reverse transcription-polymerase chain reaction (RT-PCR). Diabetic rats were induced by a single intraperitoneal injection of streptozotocin, and randomly divided into i) control rats; ii) diabetic rats; or iii) diabetic rats administered with breviscapine (10 or 25 mg x kg(-1) x d(-1)). After treatment with breviscapine for six weeks, the echocardiographic parameters were measured. All rats were then sacrificed and heart tissue was obtained for microscopy. The expression patterns of PKC, NF-kappaB, TNF-alpha, and c-fos were measured by Western blot or RT-PCR.

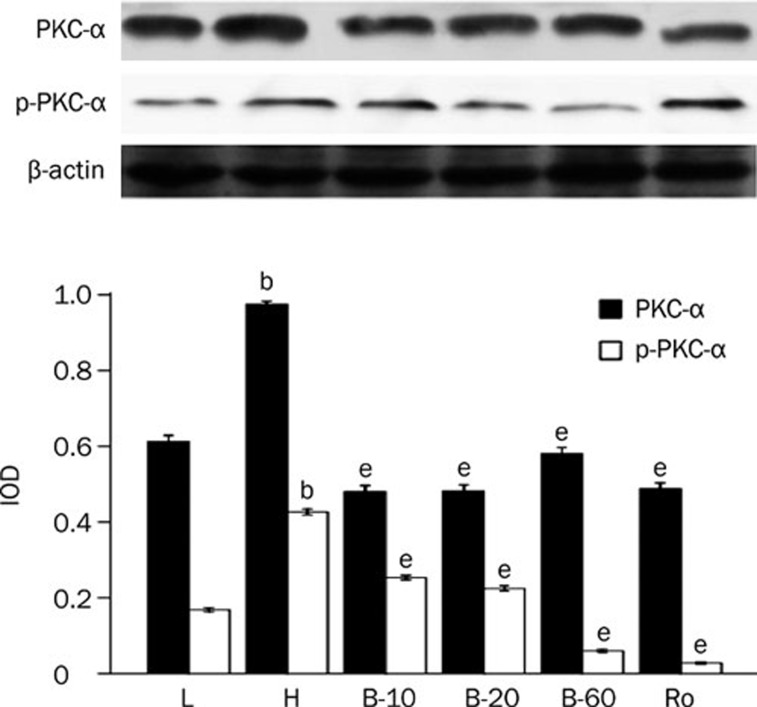
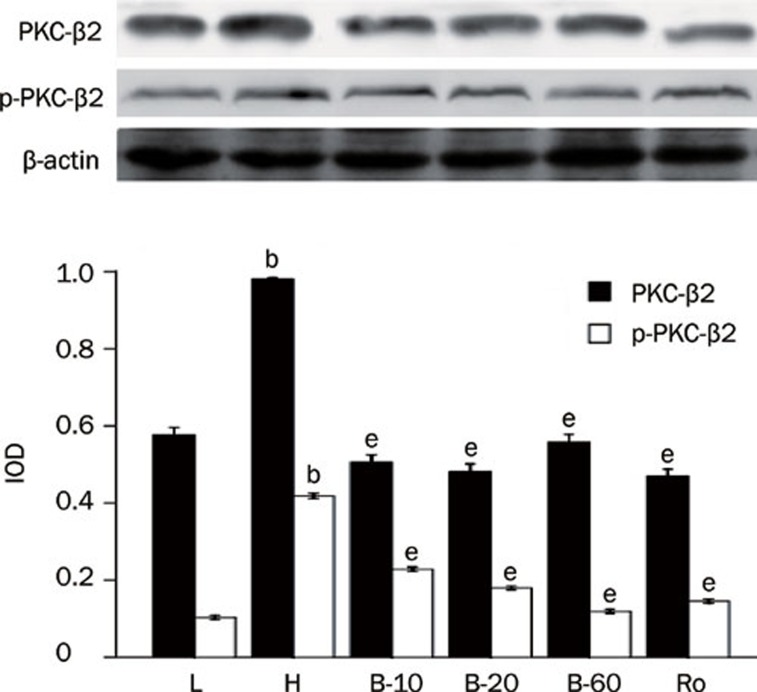
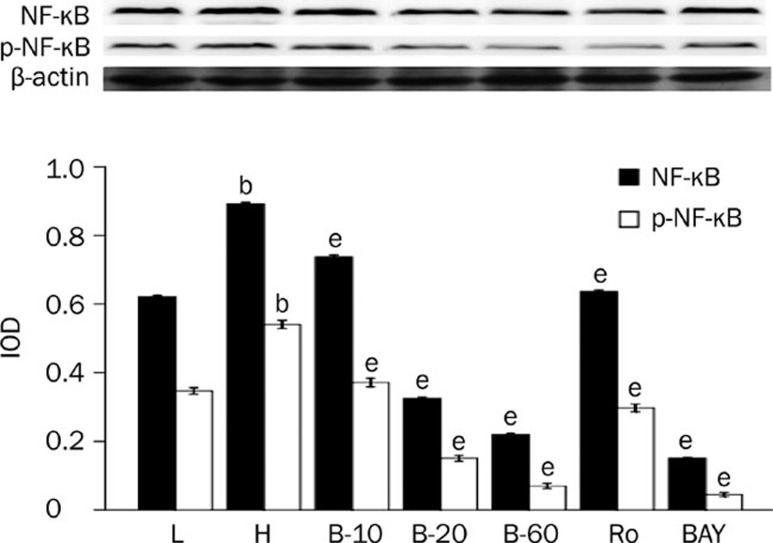
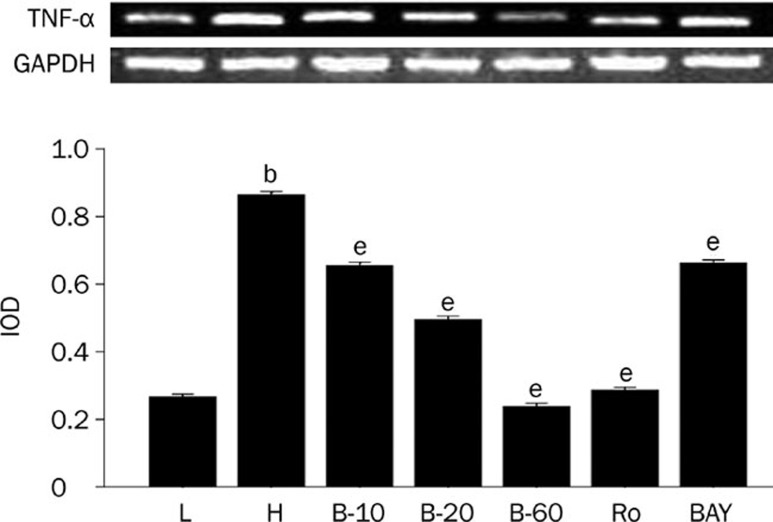
Results: Cardiomyocytes cultured in a high concentration of glucose showed an increased pulsatile frequency and cellular volume, as well as a higher expression of PKC, NF-kappaB, TNF-alpha, and c-fos compared with the control group. Breviscapine could partly prevent these changes. Diabetic rats showed relative cardiac hypertrophy and a higher expression of PKC, NF-kappaB, TNF-alpha, and c-fos; treatment with breviscapine could ameliorate these changes in diabetic cardiomyopathy.

Conclusion: Breviscapine prevented cardiac hypertrophy in diabetic rats by inhibiting the expression of PKC, which may have a protective effect in the pathogenesis of diabetic cardiomyopathy via the PKC/NF-kappaB/c-fos signal transduction pathway.


Figures

Figure 1
Figure 1
Breviscapine decreased the expression of PKC-α in high glucose cultured cardiomyocytes. Cardiomyocytes cultured in high glucose levels showed higher expression and activity of PKC-α compared with control group. After adding PKC inhibitor Ro-31-8220 (50 nmol/L) and breviscapine (10, 20, and 60 mmol/L), the expression and activity of PKC-α decreased. n=4 or 5. Mean±SEM. bP<0.05 vs control group. eP<0.05 vs high glucose group. (L: control glucose group; H: high glucose group; Ro: high glucose+PKC inhibitor Ro-31-8220 group; B-10: high glucose+10 mmol/L breviscapine; B-20: high glucose+20 mmol/L breviscapine; B-60: high glucose+60 mmol/L breviscapine group).
Figure 2
Figure 2
Breviscapine decreased the expression of PKC-β2 in high glucose cultured cardiomyocytes. Cardiomyocytes cultured in high glucose levels showed higher expression and activity of PKC-β2 compared with control group. After adding PKC inhibitor Ro-31-8220 (50 nmol/L) and breviscapine (10, 20, and 60 mmol/L), the expression and activity of PKC-β2 decreased. The results were shown in Figure 2 expressed as means±SEM (n=4 or 5). bP<0.05 vs control group. eP<0.05 vs high glucose group. (L: control glucose group; H: high glucose group; Ro: high glucose+PKC inhibitor Ro-31-8220 group; B-10: high glucose+10 mmol/L breviscapine; B-20: high glucose+20 mmol/L breviscapine; B-60: high glucose+60 mmol/L breviscapine group).
Figure 3
Figure 3
Breviscapine decreased the expression of NF-κB in high glucose cultured cardiomyocytes. Cardiomyocytes cultured in high glucose levels showed higher expression and increased activity of NF-κB compared with control group. After adding PKC inhibitor Ro-31-8220 (50 nmol/L), NF-κB inhibitor BAY11-7082 (5 μmol/L) and breviscapine (10, 20, and 60 mmol/L), the expression and activity of NF-κB decreased as shown in Figure 3. The results were expressed as means±SEM. n=4 or 5. bP<0.05 vs control group. eP<0.05 vs high glucose group. (L: control glucose group; H: high glucose group; Ro: high glucose+PKC inhibitor Ro-31-8220 group; B-10: high glucose+10 mmol/L breviscapine; B-20: high glucose+20 mmol/L breviscapine; B-60: high glucose+60 mmol/L breviscapine group; BAY: high glucose+NF-κB inhibitor BAY11-7082 group).
Figure 4
Figure 4
Breviscapine decreased the expression of TNF-α in high glucose cultured cardiomyocytes. Cardiomyocytes cultured in high glucose levels showed higher expression of TNF-α compared with control group. After adding PKC inhibitor Ro-31-8220 (50 nmol/L), NF-κB inhibitor BAY11-7082 (5 μmol/L) and breviscapine (10, 20, and 60 mmol/L), the expression of TNF-α decreased compared with the cardiomyocytes cultured in high glucose levels as shown in Figure 4. The results were expressed as means±SEM. n=4 or 5. bP<0.05 vs control group. eP<0.05 vs high glucose group. (L: control glucose group; H: high glucose group; Ro: high glucose+PKC inhibitor Ro-31-8220 group; B-10: high glucose+10 mmol/L breviscapine; B-20: high glucose+20 mmol/L breviscapine; B-60: high glucose+60 mmol/L breviscapine group; BAY: high glucose+NF-κB inhibitor BAY11-7082 group).
Figure 5
Figure 5
Breviscapine decreased the expression of c-fos in high glucose cultured cardiomyocytes. Cardiomyocytes cultured in high glucose levels showed higher expression of c-fos compared with control group. After adding PKC inhibitor Ro-31-8220 (50 nmol/L), NF-κB inhibitor BAY11-7082 (5 μmol/L) and breviscapine (10, 20, and 60 mmol/L), the expression of c-fos decreased as shown in Figure 5. The results were expressed as means±SEM. n=4 or 5. bP<0.05 vs control group. eP<0.05 vs high glucose group. (L: control glucose group; H: high glucose group; Ro: high glucose+PKC inhibitor Ro-31-8220 group; B-10: high glucose+10 mmol/L breviscapine; B-20: high glucose+20 mmol/L breviscapine; B-60: high glucose+60 mmol/L breviscapine group; BAY: high glucose+NF-κB inhibitor BAY11-7082 group).
Figure 6
Figure 6
Ultrastructure of myocardium in rats. Control rat (×20 000); diabetic rat (DM, ×20 000); diabetic rat treated with low dose of breviscapine (DM+LDB, ×20 000); diabetic rat treated with high dose of breviscapine (DM+HDB, ×20 000); 1: the loss and derangement of myofibrils; 2: swollen and distended of mitochondria; 3: dilated and fragmented sarcoplasmic reticulum.
Figure 7
Figure 7
Ultrastructure of myocardium in rats. Control rat (×50 000); diabetic rat (DM, ×50 000); diabetic rat treated with low dose of breviscapine (DM+LDB, ×50 000); diabetic rat treated with high dose of breviscapine (DM+HDB, ×50 000). 1: the loss and derangement of myofibrils; 2: swollen and distended of mitochondria; 3: dilated and fragmented sarcoplasmic reticulum.
Figure 8
Figure 8
Breviscapine decreased the expression of PKC-α in diabetic rats hearts. Diabetic rats (DM) showed higher expression of PKC-α in heart tissues compared with normal control ones (Control) analyzed by Western blot. Treatment with breviscapine reduced the expression of PKC-α in diabetic cardiomyopathy, the reduced expression of PKC-α was more obvious in diabetic rats treated with breviscapine 25 mg·kg−1·d−1 (DM+HDB) than those received 10 mg·kg−1·d−1 breviscapine (DM+LDB), β-actin was an endogenous control. Each bar represents the mean±SEM. n=8−10 rats for each group. bP<0.05 vs control group. eP<0.05 vs high glucose group.
Figure 9
Figure 9
Breviscapine decreased the expression of PKC-β2 in diabetic rats hearts. Diabetic rats (DM) showed higher expression of PKC-β2 in heart tissues compared with normal control rats (Control). Treatment with breviscapine could reduced the expression of PKC-β2 in diabetic cardiomyopathy, the reduced expression of PKC-β2 was more obvious in diabetic rats treated with 25 mg·kg−1·d−1 (DM+HDB) breviscapine than those received 10 mg·kg−1·d−1 breviscapine (DM+LDB), β-actin was an endogenous control. Each bar represents the mean±SEM. n=8−10 rats for each group. bP<0.05 vs control. eP<0.05 vs DM.
Figure 10
Figure 10
Breviscapine decreased the expression of NF-κB in diabetic rats hearts. Diabetic rats (DM) showed higher expression of NF-κB in heart tissues compared with normal control rats (Control). Treatment with breviscapine reduced the expression of NF-κB in diabetic cardiomyopathy, the reduced expression of NF-κB was more obvious in diabetic rats treated with breviscapine 25 mg·kg−1·d−1 (DM+HDB) than those received 10 mg·kg−1·d−1 breviscapine (DM+LDB), β-actin was an endogenous control. Each bar represents the mean±SEM. n=8−10 rats for each group. bP<0.05 vs control. eP<0.05 vs DM.
Figure 11
Figure 11
Breviscapine decreased the expression of TNF-α in diabetic rats hearts. Diabetic rats (DM) showed higher expression of TNF-α in heart tissues compared with normal control rats (Control) analyzed by RT-PCR. Treatment with breviscapine reduced the expression of TNF-α in diabetic cardiomyopathy, the reduced expression of TNF-α was more obvious in diabetic rats treated with breviscapine 25 mg·kg−1·d−1 (DM+HDB) than those received 10 mg·kg−1·d−1 breviscapine (DM+LDB), GAPDH was an endogenous control. Each bar represents the mean±SEM. n=8−10 rats for each group. bP<0.05 vs control. eP<0.05 vs DM.
Figure 12
Figure 12
Breviscapine decreased the expression of c-fos in diabetic rats hearts. Diabetic rats (DM) showed higher expression of c-fos in heart tissues compared with normal control rats (Control). Treatment with breviscapine reduced the expression of c-fos in diabetic cardiomyopathy, the reduced expression of c-fos was more obvious in diabetic rats treated with breviscapine 25 mg·kg−1·d−1 (DM+HDB) than those received 10 mg·kg−1·d−1 breviscapine (DM+LDB), β-actin was an endogenous control. Each bar represents the mean±SEM. n=8−10 rats for each group. bP<0.05 vs control. eP<0.05 vs DM.

References

    1. Wild S, Roglic G, Green A, Sicree R, King H. Global prevalence of diabetes: estimates for the year 2000 and projections for 2030. Diabetes Care. 2004;27:1047–53. - PubMed
    1. Boudina S, Abel ED. Diabetic cardiomyopathy revisited. Circulation. 2007;115:3213–23. - PubMed
    1. Brownlee M. The pathobiology of diabetic complications: a unifying mechanism. Diabetes. 2005;54:1615–25. - PubMed
    1. Beckman JA, Goldfine AB, Gordon MB, Garret LA, Creager MA. Inhibition of protein kinase C beta prevents impaired endothelium-dependent vasodilation caused by hyperglycaemia in humans. Circ Res. 2002;90:107–11. - PubMed
    1. Quagliaro L, Piconi L, Assaloni R, Martinelli L, Motz E, Ceriello A. Intermittent high glucose enhances apoptosis related to oxidative stress in human umbilical vein endothelial cells: the role of protein kinase C and NAD(P)H-oxidase activation. Diabetes. 2003;52:2795–804. - PubMed

MeSH terms