Genome-wide transcription analysis of histidine-related cataract in Atlantic salmon (Salmo salar L)
- PMID: 19597568
- PMCID: PMC2709424
Genome-wide transcription analysis of histidine-related cataract in Atlantic salmon (Salmo salar L)
Abstract
Purpose: Elevated levels of dietary histidine have previously been shown to prevent or mitigate cataract formation in farmed Atlantic salmon (Salmo salar L). The aim of this study was to shed light on the mechanisms by which histidine acts. Applying microarray analysis to the lens transcriptome, we screened for differentially expressed genes in search for a model explaining cataract development in Atlantic salmon and possible markers for early cataract diagnosis.
Methods: Adult Atlantic salmon (1.7 kg) were fed three standard commercial salmon diets only differing in the histidine content (9, 13, and 17 g histidine/kg diet) for four months. Individual cataract scores for both eyes were assessed by slit-lamp biomicroscopy. Lens N-acetyl histidine contents were measured by high performance liquid chromatography (HPLC). Total RNA extracted from whole lenses was analyzed using the GRASP 16K salmonid microarray. The microarray data were analyzed using J-Express Pro 2.7 and validated by quantitative real-time polymerase chain reaction (qRT-PCR).
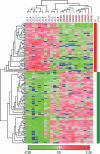
Results: Fish developed cataracts with different severity in response to dietary histidine levels. Lens N-acetyl histidine contents reflected the dietary histidine levels and were negatively correlated to cataract scores. Significance analysis of microarrays (SAM) revealed 248 significantly up-regulated transcripts and 266 significantly down-regulated transcripts in fish that were fed a low level of histidine compared to fish fed a higher histidine level. Among the differentially expressed transcripts were metallothionein A and B as well as transcripts involved in lipid metabolism, carbohydrate metabolism, regulation of ion homeostasis, and protein degradation. Hierarchical clustering and correspondence analysis plot confirmed differences in gene expression between the feeding groups. The differentially expressed genes could be categorized as "early" and "late" responsive according to their expression pattern relative to progression in cataract formation.
Conclusions: Dietary histidine regimes affected cataract formation and lens gene expression in adult Atlantic salmon. Regulated transcripts selected from the results of this genome-wide transcription analysis might be used as possible biological markers for cataract development in Atlantic salmon.
Figures


Similar articles
-
Dietary histidine supplementation prevents cataract development in adult Atlantic salmon, Salmo salar L., in seawater.Br J Nutr. 2010 Nov;104(10):1460-70. doi: 10.1017/S0007114510002485. Epub 2010 Aug 9. Br J Nutr. 2010. PMID: 20691125 Clinical Trial.
-
Susceptibility of Atlantic salmon lenses to hydrogen peroxide oxidation ex vivo after being fed diets with vegetable oil and methylmercury.Exp Eye Res. 2011 May;92(5):414-24. doi: 10.1016/j.exer.2011.02.018. Epub 2011 Mar 4. Exp Eye Res. 2011. PMID: 21377462
-
Dietary histidine requirement to reduce the risk and severity of cataracts is higher than the requirement for growth in Atlantic salmon smolts, independently of the dietary lipid source.Br J Nutr. 2014 May 28;111(10):1759-72. doi: 10.1017/S0007114513004418. Epub 2014 Feb 27. Br J Nutr. 2014. PMID: 24576359
-
Atlantic salmon (Salmo salar L.) genetics in the 21st century: taking leaps forward in aquaculture and biological understanding.Anim Genet. 2019 Feb;50(1):3-14. doi: 10.1111/age.12748. Epub 2018 Nov 14. Anim Genet. 2019. PMID: 30426521 Free PMC article. Review.
-
Immunoglobulin isotypes in Atlantic salmon, Salmo salar.Biomolecules. 2015 Feb 27;5(1):166-77. doi: 10.3390/biom5010166. Biomolecules. 2015. PMID: 25734583 Free PMC article. Review.
Cited by
-
Safety and efficacy of l-histidine monohydrochloride monohydrate produced by fermentation with Escherichia coli (NITE BP-02526) for all animal species.EFSA J. 2019 Aug 8;17(8):e05785. doi: 10.2903/j.efsa.2019.5785. eCollection 2019 Aug. EFSA J. 2019. PMID: 32626407 Free PMC article.
-
N-acetyl-L-histidine, a Prominent Biomolecule in Brain and Eye of Poikilothermic Vertebrates.Biomolecules. 2015 Apr 24;5(2):635-46. doi: 10.3390/biom5020635. Biomolecules. 2015. PMID: 25919898 Free PMC article.
-
Histological and transcriptomic analysis of muscular atrophy associated with depleted flesh pigmentation in Atlantic salmon (Salmo salar) exposed to elevated seawater temperatures.Sci Rep. 2023 Mar 14;13(1):4218. doi: 10.1038/s41598-023-31242-2. Sci Rep. 2023. PMID: 36918611 Free PMC article.
-
Optimisation of gene expression analysis in Atlantic salmon lenses by refining sampling strategy and tissue storage.Fish Physiol Biochem. 2010 Dec;36(4):1217-25. doi: 10.1007/s10695-010-9401-z. Epub 2010 May 15. Fish Physiol Biochem. 2010. PMID: 20473564
-
Histidine: A Systematic Review on Metabolism and Physiological Effects in Human and Different Animal Species.Nutrients. 2020 May 14;12(5):1414. doi: 10.3390/nu12051414. Nutrients. 2020. PMID: 32423010 Free PMC article.
References
-
- Brown NAP, Bron AJ, editors. Lens disorders: a clinical manual of cataract diagnosis. Oxford: Butterworth-Heinemann; 1996.
-
- Hughes SG. Nutritional Eye Diseases in Salmonids - a Review. Prog Fish-Cult. 1985;47:81–5.
-
- Menzies FD, Crockford T, Breck O, Midtlyng PJ. Estimation of direct costs associated with cataracts in farmed Atlantic salmon (Salmo salar). Bull Eur Assoc Fish Pathol. 2002;22:27–32.
-
- Bjerkås E, Breck O, Waagbo R. The role of nutrition in cataract formation in farmed fish. CAB Reviews: Perspectives in Agriculture, Veterinary Science, Nutrition and Natural Resources. 2006;1:1–16.
-
- NRC. Nutrient requirements of fish. Washington DC: National Academy Press; 1993.
Publication types
MeSH terms
Substances
LinkOut - more resources
Full Text Sources
Medical
