A phylogenetic approach to gene expression data: evidence for the evolutionary origin of mammalian leukocyte phenotypes
- PMID: 19601972
- PMCID: PMC2810715
- DOI: 10.1111/j.1525-142X.2009.00345.x
A phylogenetic approach to gene expression data: evidence for the evolutionary origin of mammalian leukocyte phenotypes
Abstract
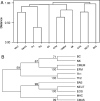
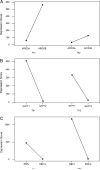
The evolution of multicellular organisms involved the evolution of specialized cell types performing distinct functions; and specialized cell types presumably arose from more generalized ancestral cell types as a result of mutational event, such as gene duplication and changes in gene expression. We used characters based on gene expression data to reconstruct evolutionary relationships among 11 types of lymphocytes by the maximum parsimony method. The resulting phylogenetic tree showed expected patterns including separation of the lymphoid and myeloid lineages; clustering together of granulocyte types; and pairing of phenotypically similar cell types such as T-helper cells type 1 and T-helper cells type 2 (Th1 and Th2). We used phylogenetic analyses of sequence data to determine the time of origin of genes showing significant expression difference between Th1 and Th2 cells. Many such genes, particularly those involved in the regulation of gene expression or activation of proteins, were of ancient origin, having arisen by gene duplication before the most recent common ancestor (MRCA) of tetrapods and teleosts. However, certain other genes with significant expression difference between Th1 and Th2 arose after the tetrapod-teleost MRCA, and some of the latter were specific to eutherian (placental) mammals. This evolutionary pattern is consistent with previous evidence that, while bony fishes possess Th1 and Th2 cells, the latter differ phenotypically in important respects from the corresponding cells of mammals. Our results support a gradualistic model of the evolution of distinctive cellular phenotypes whereby the unique characteristics of a given cell type arise as a result of numerous independent mutational changes over hundreds of millions of years.
Figures


References
-
- Bilic I, Ellmeier W. The role of BTB domain-containing zinc finger proteins in T cell development and function. Immunol. Lett. 2007;108:1–9. - PubMed
-
- Bruni P, et al. Fe65, a ligand of the Alzheimer's β-amyloid precursor protein, blocks cell cycle progression by down-regulating thymididate synthase expression. J. Biol. Chem. 2002;277:35481–35488. - PubMed
-
- Callard RE, Gearing AJ. The Cytokine Factsbook. Academic Press; London: 1994.
Publication types
MeSH terms
Grants and funding
LinkOut - more resources
Full Text Sources

