

Morphometric integration and modularity in configurations of landmarks: tools for evaluating a priori hypotheses
- PMID: 19601974
- PMCID: PMC2776930
- DOI: 10.1111/j.1525-142X.2009.00347.x
Morphometric integration and modularity in configurations of landmarks: tools for evaluating a priori hypotheses
Abstract
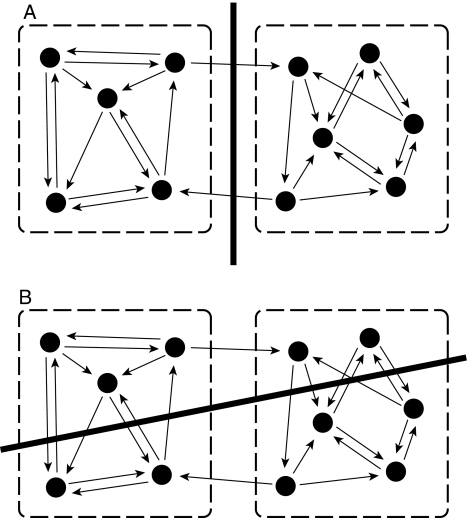
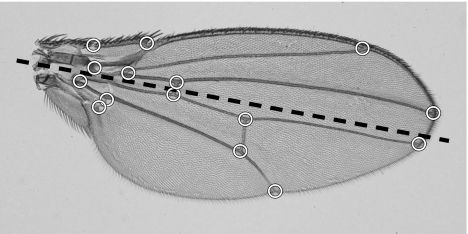
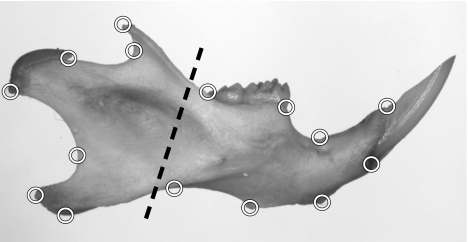
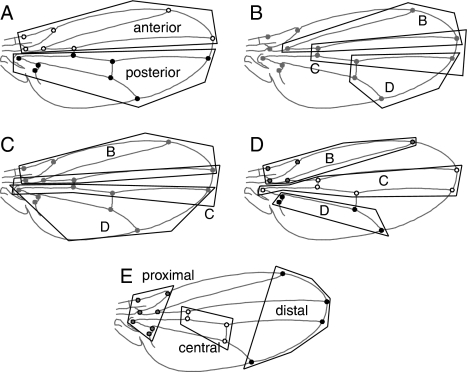
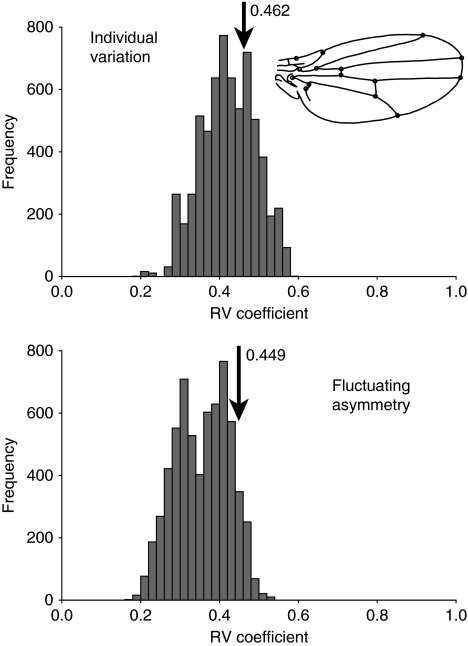
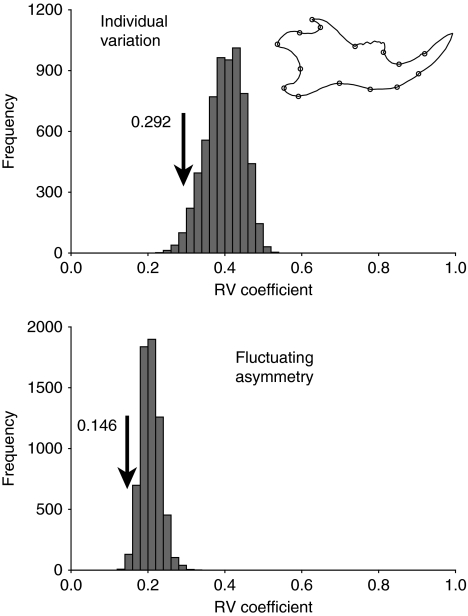
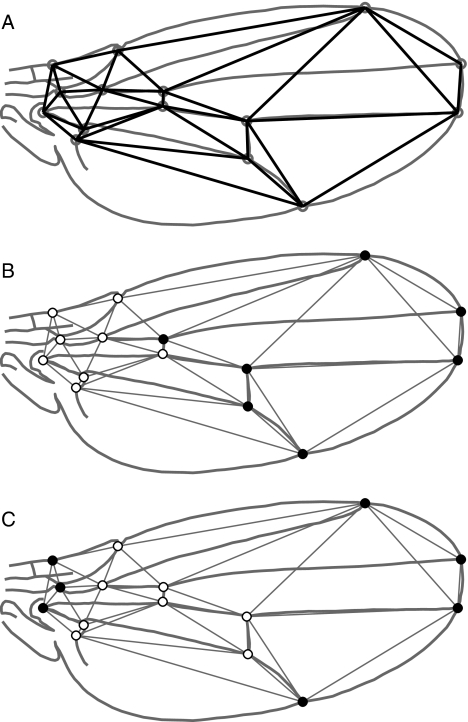
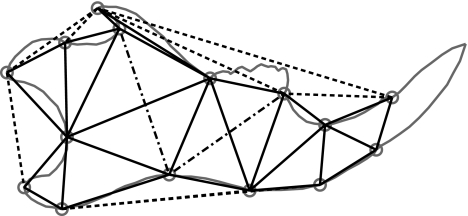
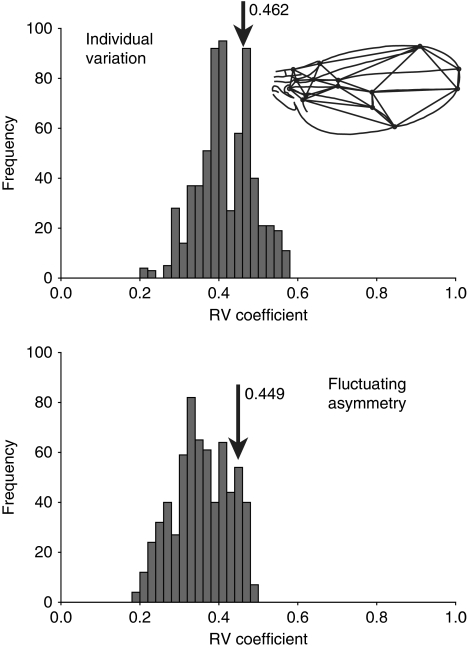
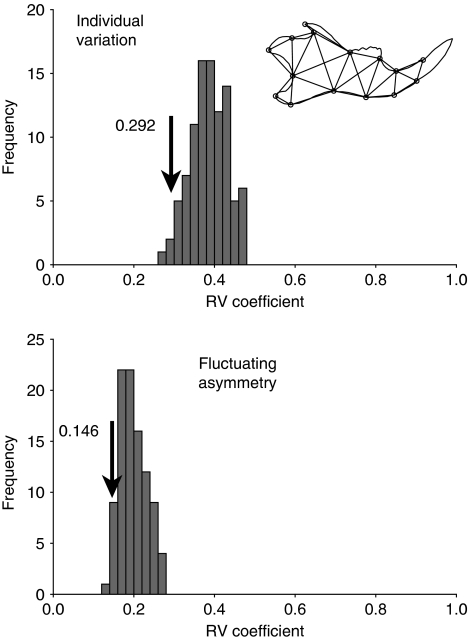
Identifying the modular components of a configuration of landmarks is an important task of morphometric analyses in evolutionary developmental biology. Modules are integrated internally by many interactions among their component parts, but are linked to one another only by few or weak interactions. Accordingly, traits within modules are tightly correlated with each other, but relatively independent of traits in other modules. Hypotheses concerning the boundaries of modules in a landmark configuration can therefore be tested by comparing the strength of covariation among alternative partitions of the configuration into subsets of landmarks. If a subdivision coincides with the true boundaries between modules, the correlations among subsets should be minimal. This article introduces Escoufier's RV coefficient and the multi-set RV coefficient as measures of the correlation between two or more subsets of landmarks. These measures can be compared between alternative partitions of the configuration into subsets. Because developmental interactions are tissue bound, it is sensible to require that modules should be spatially contiguous. I propose a criterion for spatial contiguity for sets of landmarks using an adjacency graph. The new methods are demonstrated with data on shape of the wing in Drosophila melanogaster and the mandible of the house mouse.
Figures
Similar articles
-
Developmental integration in a complex morphological structure: how distinct are the modules in the mouse mandible?Evol Dev. 2003 Sep-Oct;5(5):522-31. doi: 10.1046/j.1525-142x.2003.03057.x. Evol Dev. 2003. PMID: 12950630
-
Drosophila wing modularity revisited through a quantitative genetic approach.Evolution. 2016 Jul;70(7):1530-41. doi: 10.1111/evo.12975. Epub 2016 Jun 24. Evolution. 2016. PMID: 27272402
-
Integration and modularity of quantitative trait locus effects on geometric shape in the mouse mandible.Genetics. 2004 Apr;166(4):1909-21. doi: 10.1534/genetics.166.4.1909. Genetics. 2004. PMID: 15126408 Free PMC article.
-
Haltere development in D. melanogaster: implications for the evolution of appendage size, shape and function.Int J Dev Biol. 2020;64(1-2-3):159-165. doi: 10.1387/ijdb.190133LS. Int J Dev Biol. 2020. PMID: 32659004 Review.
-
Wing vein patterning in Drosophila and the analysis of intercellular signaling.Annu Rev Cell Dev Biol. 2007;23:293-319. doi: 10.1146/annurev.cellbio.23.090506.123606. Annu Rev Cell Dev Biol. 2007. PMID: 17506700 Review.
Cited by
-
Phenotypic divergence of Glossina morsitans (Diptera: Glossinidae) populations in Zambia: Application of landmark-based wing geometric morphometrics to discriminate population-level variation.Ecol Evol. 2024 Sep 30;14(10):e70348. doi: 10.1002/ece3.70348. eCollection 2024 Oct. Ecol Evol. 2024. PMID: 39355111 Free PMC article.
-
Assessing the effects of tooth loss in adult crania using geometric morphometrics.Int J Legal Med. 2016 Jan;130(1):233-43. doi: 10.1007/s00414-015-1174-6. Epub 2015 Mar 18. Int J Legal Med. 2016. PMID: 25784387
-
Mind the gap: genetic manipulation of basicranial growth within synchondroses modulates calvarial and facial shape in mice through epigenetic interactions.PLoS One. 2015 Feb 18;10(2):e0118355. doi: 10.1371/journal.pone.0118355. eCollection 2015. PLoS One. 2015. PMID: 25692674 Free PMC article.
-
Neurocranium versus Face: A Morphometric Approach with Classical Anthropometric Variables for Characterizing Patterns of Cranial Integration in Extant Hominoids and Extinct Hominins.PLoS One. 2015 Jul 15;10(7):e0131055. doi: 10.1371/journal.pone.0131055. eCollection 2015. PLoS One. 2015. PMID: 26177535 Free PMC article.
-
Shell variability in the stem turtles Proterochersis spp.PeerJ. 2018 Dec 21;6:e6134. doi: 10.7717/peerj.6134. eCollection 2018. PeerJ. 2018. PMID: 30595986 Free PMC article.
References
-
- Ackermann RR. Ontogenetic integration of the hominoid face. J. Hum. Evol. 2005;48:175–197. - PubMed
-
- Atchley WR, Cowley DE, Vogl C, McLellan T. Evolutionary divergence, shape change, and genetic correlation structure in the rodent mandible. Syst. Biol. 1992;41:196–221.
-
- Atchley WR, Hall BK. A model for development and evolution of complex morphological structures. Biol. Rev. (Camb.) 1991;66:101–157. - PubMed
-
- Bastir M, Rosas A. Hierarchical nature of morphological integration and modularity in the human posterior face. Am. J. Phys. Anthropol. 2005;128:26–34. - PubMed
Publication types
MeSH terms
Grants and funding
LinkOut - more resources
Full Text Sources
Molecular Biology Databases
