. 2009 Aug;13(8B):2224-2235.
doi: 10.1111/j.1582-4934.2008.00554.x.

Role of EG-VEGF in human placentation: Physiological and pathological implications

Affiliations

Role of EG-VEGF in human placentation: Physiological and pathological implications

Pascale Hoffmann et al. J Cell Mol Med. 2009 Aug.

Abstract

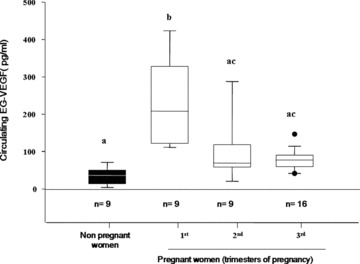
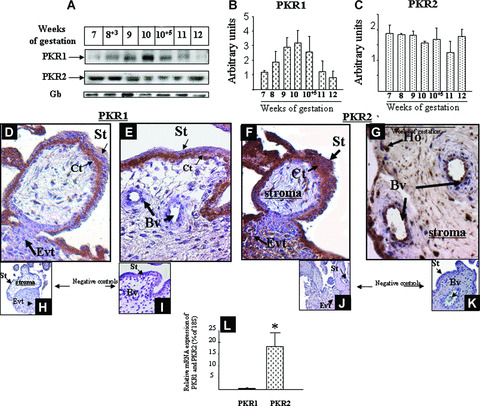
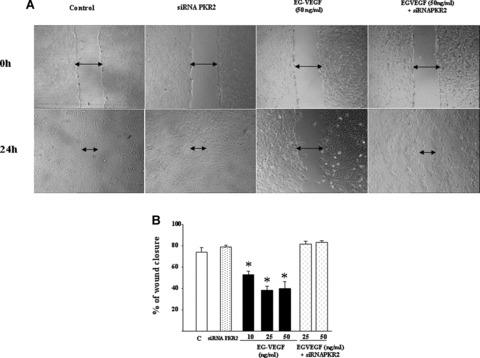
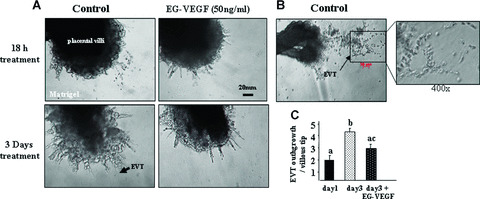
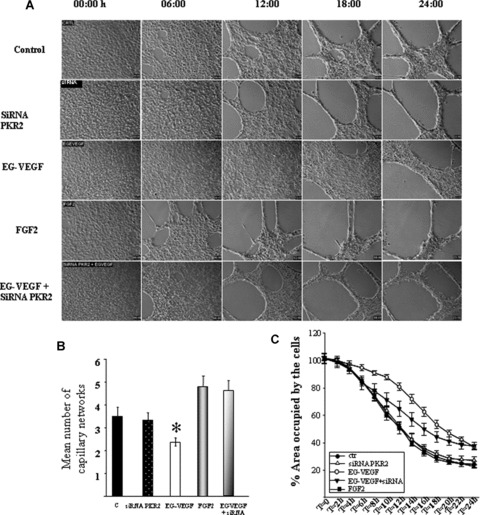
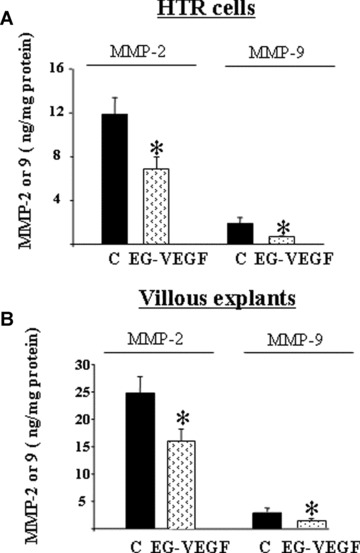
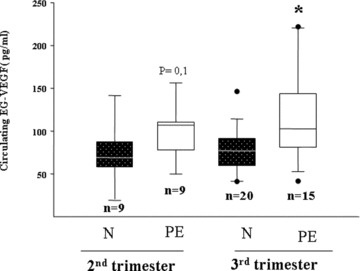
Pre-eclampsia (PE), the major cause of maternal morbidity and mortality, is thought to be caused by shallow invasion of the maternal decidua by extravillous trophoblasts (EVT). Data suggest that a fine balance between the expressions of pro- and anti-invasive factors might regulate EVT invasiveness. Recently, we showed that the expression of the new growth factor endocrine gland-derived vascular endothelial growth factor (EG-VEGF) is high in early pregnancy but falls after 11 weeks, suggesting an essential role for this factor in early pregnancy. Using human villous explants and HTR-8/SVneo, a first trimester extravillous trophoblast cell line, we showed differential expression of EG-VEGF receptors, PKR1 and PKR2, in the placenta and demonstrated that EG-VEGF inhibits EVT migration, invasion and tube-like organisation. EG-VEGF inhibitory effect on invasion was supported by a decrease in matrix metalloproteinase (MMP)-2 and MMP-9 production. Interference with PKR2 expression, using specific siRNAs, reversed the EG-VEGF-induced inhibitory effects. Furthermore, we determined EG-VEGF circulating levels in normal and PE patients. Our results showed that EG-VEGF levels were highest during the first trimester of pregnancy and decreased thereafter to non-pregnant levels. More important, EG-VEGF levels were significantly elevated in PE patients compared with age-matched controls. These findings identify EG-VEGF as a novel paracrine regulator of trophoblast invasion. We speculate that a failure to correctly down-regulate placental expression of EG-VEGF at the end of the first trimester of pregnancy might lead to PE.


Figures

Figure 1
Figure 1
EG‐VEGF serum levels in non‐pregnant and pregnant women at the first, second and third trimesters. A total of 42 serum samples were analysed. EG‐VEGF contents were measured by ELISA. Box plot demonstrates 10th, 25th, 50th, 75th and 90th percentiles. (*P < 0.05, by ANOVA followed by Dunn's method). Values overwritten with different letters are significantly different from each other.
Figure 2
Figure 2
PKR1 and PKR2 protein expression in placental villi during the first trimester of pregnancy. (A) The panel shows a representative Western blot analysis of PKR1 and PKR2 in placental tissues from 7 to 12 wg. For each gestational age, two placentas were examined. Panels B and C show histograms of the mean relative OD of PKR1 and PKR2 protein signals normalised to protein Gβ, respectively. Data are the mean ± SD. Panels F and G show placental column and chorionic villi at 10 wg immunostained with anti‐PKR1 and anti‐PKR2, respectively. The undersized photographs in panels H–K show tissues section incubated with pre‐immune sera for either PKR1 or PKR2. Cytotrophoblast (Ct), Hobfauer cells (Ho), Extravillous trophoblast (EVT) syncytiotrophoblast (St), Blood vessels (Bv). Panel L shows a comparison of PKR1 and PKR2 mRNAs in HTR‐8 cells (*P < 0.05).
Figure 3
Figure 3
Effect of EG‐VEGF on the migration of HTR‐8 cells. Panel A shows photographs of HTR‐8 monolayer at 0 hr and 24 hrs after the wounding at 0 hr in the control, PKR2 siRNA, EG‐VEGF (50 ng/ml) and EG‐VEGF plus PKR2 siRNA conditions. Panel B shows the percentage of wound closure 24 hrs after the treatment with EG‐VEGF (10, 25 or 50 ng/ml) in the absence or presence of PKR2 siRNA (*P < 0.05).
Figure 4
Figure 4
Effect of EG‐VEGF on the invasion of EVT cell in situ. Panel A shows EG‐VEGF effect on EVT invasion in villous explants’ culture. EG‐VEGF (50 ng/ml) treatment started 24 hrs after the launch of the culture. Panel B shows increased budding and outgrowth of EVT from the distal end of the villous tips in the control condition at day 3 of culture. Panel C shows quantification of EVT outgrowths per villous tip in the absence or presence of EG‐VEGF in six independent experiments performed in triplicate (*P < 0.05). Data represent the mean ± SEM. Values overwritten with different letters are significantly different from each other.
Figure 5
Figure 5
Effect of EG‐VEGF on HTR‐8 tube‐like formation. Panel A shows photographs of HTR‐8 cells cultured on Matrigel at 6, 12, 18 and 24 hrs in the absence or the presence of EG‐VEGF (50 ng/ml), FGF‐2 (20 ng/ml) or EG‐VEGF plus siRNA PKR2. Note that EG‐VEGF delayed HTR‐8 cells organisation in tube‐like structures compared with the control, FGF‐2 and EG‐VEGF plus siRNA conditions. Panel B shows quantification of the number of tube‐like structures formed after 24 hrs under the four conditions. Panel C shows measurement of the percentage area occupied by the cells under the control, control plus siRNA, EG‐VEGF, FGF‐2 and EG‐VEGF plus siRNA conditions during 24 hrs. *P < 0.05.
Figure 6
Figure 6
Effect of EG‐VEGF on MMP‐2 and MMP‐9 production. Panels A and B show effects of EG‐VEGF on total MMP‐2 and MMP‐9 production assessed by ELISA of conditioned media collected from HTR‐8 cells for 24 hrs (A) or villous explants cultured for 48 hrs on Matrigel (B) in the absence or presence of EG‐VEGF (50 ng/ml). Data represent the mean ± SEM (*P < 0.05).
Figure 7
Figure 7
EG‐VEGF serum levels in normal and PE patient at the second and third trimesters of pregnancy. A total of 53 serum samples were analysed. EG‐VEGF contents were measured by ELISA in sera from normal (N) women and pre‐eclamptic (PE) patients. Box plot demonstrates 10th, 25th, 50th, 75th and 90th percentiles. (*P < 0.05, by ANOVA followed by Dunn's method).

References

    1. Cross JC, Werb Z, Fisher SJ. Implantation and the placenta: key pieces of the development puzzle. Science . 1994; 266: 1508–18. - PubMed
    1. Strickland S, Richards WG. Invasion of the trophoblasts. Cell . 1992; 71: 355–7. - PubMed
    1. Aplin JD. Implantation, trophoblast differentiation and haemochorial placentation: mechanistic evidence in vivo and in vitro. J Cell Sci . 1991; 99: 681–92. - PubMed
    1. Sibai B, Dekker G, Kupferminc M. Pre‐eclampsia. Lancet . 2005; 365: 785–99. - PubMed
    1. Wells M. The pathology of gestational trophoblastic disease: recent advances. Pathology . 2007; 39: 88–96. - PubMed

Publication types

Substances