

Comparing urinary biomarkers of airborne and dermal exposure to polycyclic aromatic compounds in asphalt-exposed workers
- PMID: 19602502
- PMCID: PMC2723216
- DOI: 10.1093/annhyg/mep042
Comparing urinary biomarkers of airborne and dermal exposure to polycyclic aromatic compounds in asphalt-exposed workers
Abstract
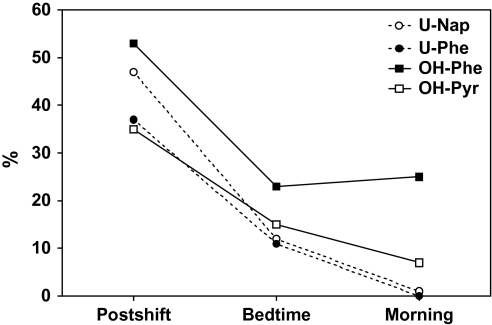
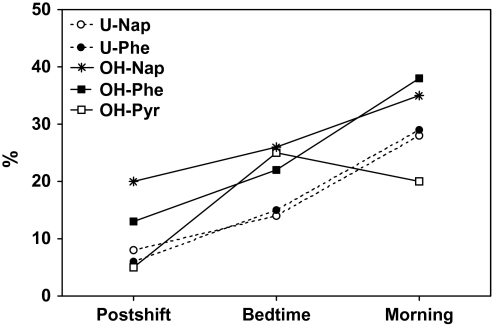
When working with hot mix asphalt, road pavers are exposed to polycyclic aromatic hydrocarbons (PAHs) through the inhalation of vapors and particulate matter (PM) and through dermal contact with PM and contaminated surfaces. Several PAHs with four to six rings are potent carcinogens which reside in these particulate emissions. Since urinary biomarkers of large PAHs are rarely detectable in asphalt workers, attention has focused upon urinary levels of the more volatile and abundant two-ring and three-ring PAHs as potential biomarkers of PAH exposure. Here, we compare levels of particulate polycyclic aromatic compounds (P-PACs, a group of aromatic hydrocarbons containing PAHs and heterocyclic compounds with four or more rings) in air and dermal patch samples from 20 road pavers to the corresponding urinary levels of naphthalene (U-Nap) (two rings), phenanthrene (U-Phe) (three rings), monohydroxylated metabolites of naphthalene (OH-Nap) and phenanthrene (OH-Phe), and 1-hydroxypyrene (OH-Pyr) (four rings), the most widely used biomarker of PAH exposure. For each worker, daily breathing-zone air (n = 55) and dermal patch samples (n = 56) were collected on three consecutive workdays along with postshift, bedtime, and morning urine samples (n = 149). Measured levels of P-PACs and the urinary analytes were used to statistically model exposure-biomarker relationships while controlling for urinary creatinine, smoking status, age, body mass index, and the timing of urine sampling. Levels of OH-Phe in urine collected postshift, at bedtime, and the following morning were all significantly associated with levels of P-PACs in air and dermal patch samples. For U-Nap, U-Phe, and OH-Pyr, both air and dermal patch measurements of P-PACs were significant predictors of postshift urine levels, and dermal patch measurements were significant predictors of bedtime urine levels (all three analytes) and morning urine levels (U-Nap and OH-Pyr only). Significant effects of creatinine concentration were observed for all analytes, and modest effects of smoking status and body mass index were observed for U-Phe and OH-Pyr, respectively. Levels of OH-Nap were not associated with P-PAC measurements in air or dermal patch samples but were significantly affected by smoking status, age, day of sample collection, and urinary creatinine. We conclude that U-Nap, U-Phe, OH-Phe, and OH-Pyr can be used as biomarkers of exposure to particulate asphalt emissions, with OH-Phe being the most promising candidate. Indications that levels of U-Nap, U-Phe, and OH-Pyr were significantly associated with dermal patch measurements well into the evening after a given work shift, combined with the small ratios of within-person variance components to between-person variance components at bedtime, suggest that bedtime measurements may be useful for investigating dermal PAH exposures.
Figures
Similar articles
-
Investigation of PAH biomarkers in the urine of workers exposed to hot asphalt.Ann Occup Hyg. 2009 Aug;53(6):551-60. doi: 10.1093/annhyg/mep041. Epub 2009 Jul 14. Ann Occup Hyg. 2009. PMID: 19602500 Free PMC article.
-
Using urinary biomarkers of polycyclic aromatic compound exposure to guide exposure-reduction strategies among asphalt paving workers.Ann Occup Hyg. 2012 Nov;56(9):1013-24. doi: 10.1093/annhyg/mes058. Epub 2012 Sep 20. Ann Occup Hyg. 2012. PMID: 23002274
-
Urinary hydroxylated metabolites of polycyclic aromatic hydrocarbons as biomarkers of exposure in asphalt workers.Biomarkers. 2007 May-Jun;12(3):221-39. doi: 10.1080/13547500601100110. Biomarkers. 2007. PMID: 17453738
-
Urinary 1-hydroxypyrene and other PAH metabolites as biomarkers of exposure to environmental PAH in air particulate matter.Toxicol Lett. 1999 Sep 5;108(2-3):191-9. doi: 10.1016/s0378-4274(99)00089-2. Toxicol Lett. 1999. PMID: 10511262 Review.
-
Benchmark guideline for urinary 1-hydroxypyrene as biomarker of occupational exposure to polycyclic aromatic hydrocarbons.Ann Occup Hyg. 2001 Jan;45(1):3-13. Ann Occup Hyg. 2001. PMID: 11137694 Review.
Cited by
-
Desorption of polycyclic aromatic hydrocarbons from field-contaminated soil to a two-dimensional hydrophobic surface before and after bioremediation.Chemosphere. 2012 Oct;89(5):542-7. doi: 10.1016/j.chemosphere.2012.05.046. Epub 2012 Jun 15. Chemosphere. 2012. PMID: 22704210 Free PMC article.
-
Underground emissions and miners' personal exposure to diesel and renewable diesel exhaust in a Swedish iron ore mine.Int Arch Occup Environ Health. 2022 Aug;95(6):1369-1388. doi: 10.1007/s00420-022-01843-x. Epub 2022 Mar 16. Int Arch Occup Environ Health. 2022. PMID: 35294627 Free PMC article.
-
Biomarkers of exposure to polycyclic aromatic hydrocarbons (PAHs) and DNA damage: a cross-sectional pilot study among roofers in South Florida.BMJ Open. 2012 Jul 19;2(4):e001318. doi: 10.1136/bmjopen-2012-001318. Print 2012. BMJ Open. 2012. PMID: 22815468 Free PMC article.
-
A proposal for assessing study quality: Biomonitoring, Environmental Epidemiology, and Short-lived Chemicals (BEES-C) instrument.Environ Int. 2014 Dec;73:195-207. doi: 10.1016/j.envint.2014.07.011. Epub 2014 Aug 17. Environ Int. 2014. PMID: 25137624 Free PMC article.
-
Human biomarker interpretation: the importance of intra-class correlation coefficients (ICC) and their calculations based on mixed models, ANOVA, and variance estimates.J Toxicol Environ Health B Crit Rev. 2018;21(3):161-180. doi: 10.1080/10937404.2018.1490128. Epub 2018 Aug 1. J Toxicol Environ Health B Crit Rev. 2018. PMID: 30067478 Free PMC article.
References
-
- Boeniger MF, Lowry LK, Rosenberg J. Interpretation of urine results used to assess chemical exposure with emphasis on creatinine adjustments: a review. Am Ind Hyg Assoc J. 1993;54:615–27. - PubMed
-
- Boffetta P, Jourenkova N, Gustavsson P. Cancer risk from occupational and environmental exposure to polycyclic aromatic hydrocarbons. Cancer Causes Control. 1997;8:444–72. - PubMed
-
- Boffetta P, Burstyn I, Partanen T, et al. Cancer mortality among European asphalt workers: an international epidemiological study. I. Results of the analysis based on job titles. Am J Ind Med. 2003a;43:18–27. - PubMed
-
- Boffetta P, Burstyn I, Partanen T, et al. Cancer mortality among European asphalt workers: an international epidemiological study. II. Exposure to bitumen fume and other agents. Am J Ind Med. 2003b;43:28–39. - PubMed
Publication types
MeSH terms
Substances
Grants and funding
LinkOut - more resources
Full Text Sources
Other Literature Sources
Medical
Research Materials
