. 2009 Sep;19(9):1675-81.
doi: 10.1101/gr.094615.109. Epub 2009 Jul 14.

Instrumenting the health care enterprise for discovery research in the genomic era

Affiliations

Instrumenting the health care enterprise for discovery research in the genomic era

Shawn Murphy et al. Genome Res. 2009 Sep.

Abstract

Tens of thousands of subjects may be required to obtain reliable evidence relating disease characteristics to the weak effects typically reported from common genetic variants. The costs of assembling, phenotyping, and studying these large populations are substantial, recently estimated at three billion dollars for 500,000 individuals. They are also decade-long efforts. We hypothesized that automation and analytic tools can repurpose the informational byproducts of routine clinical care, bringing sample acquisition and phenotyping to the same high-throughput pace and commodity price-point as is currently true of genome-wide genotyping. Described here is a demonstration of the capability to acquire samples and data from densely phenotyped and genotyped individuals in the tens of thousands for common diseases (e.g., in a 1-yr period: N = 15,798 for rheumatoid arthritis; N = 42,238 for asthma; N = 34,535 for major depressive disorder) in one academic health center at an order of magnitude lower cost. Even for rare diseases caused by rare, highly penetrant mutations such as Huntington disease (N = 102) and autism (N = 756), these capabilities are also of interest.


Figures
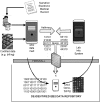
Figure 1.
Figure 1.
Matching anonymously identified populations to anonymous samples. An i2b2 datamart is generated from codified data (e.g., billing codes, laboratory test values) and concepts codified by running the narrative text in electronic medical records through a NLP tool, the HITEx package described in the Methods section. Patients included within the i2b2 datamart meeting study criteria are selected and their corresponding set of identifiers are generated. Those identifiers are forwarded to the Crimson application, which scans recent transactions forwarded from one or more local clinical laboratory or pathology information systems to identify newly accessioned materials matching the cohort identifiers and desired sample types. Upon completion of diagnostic testing (1–3 d after collection in most cases), Crimson manages reaccession of the sample to a study's IRB protocol and assigns the i2b2-forwarded subject ID to a uniquely generated sample ID. These actions remove all identifiers (accession no., medical record no., etc.) from the original sample. The sample may then be released to the investigator where it can be measured (for genome-wide genotyping in this instance), and these measurement data are merged with the phenotypic data set in the i2b2 datamart. Because of the electronic and regulatory firewalls, only research personnel approved by the IRB can view the limited data set (in the HIPAA sense), and they cannot view the identified clinical data visible to those who access the laboratory information system.
Figure 2.
Figure 2.
Cumulative accrual of phenotyped DNA samples for the asthma DBP. Unlike the membership of the overall asthma datamart (N = 131,230), the pool from which patients were drawn was first restricted to those seen at the Brigham and Women's Hospital where the Crimson system was first deployed, as the second Crimson site (Massachusetts General Hospital) came online only in late 2008. Additional restrictions included age (<45 yr, >15 yr) and smoking status (nonsmoker or ex-smoker). Projected (A) and actual (B) accrual rates for four groups: LCA (Low-utilizer Caucasian American); LAA (Low-utilizer African American); HCA (High-utilizer Caucasian American); HAA (High-utilizer African American). Utilization here is defined by the absence of hospital admissions (low utilizer) in contrast to at least two admissions (high utilizer). As shown above, the recruitment of low utilitzers (LCA and LAA) started later than the recruitment of the high utilizers. Nonetheless, the projected recruitment rates and the actual recruitment rates are very similar.
Figure 3.
Figure 3.
Projected accrual rates. Estimates are based on the number of patients previously seen at least once during the 36 mo before June 30, 2006 for whom at least one patient visit during which chemistry or hematology samples were obtained was then recorded in the following 12 mo. Each patient was only counted once, even if they had more than one visit in the 12-mo period. Also, unlike Figure 2, accrual rates per week rather than cumulative accrual are shown. There are some common features in the accrual trajectories for most of the diseases because of the shared exposure to the effects of holidays and seasonality on hospital visits. (A) Accrual for common diseases: (MDD) major depressive disorder; (RA) rheumatoid arthritis (all individuals and not just those who met driving biological projects criteria); asthma (also all individuals). (B) Accrual for less prevalent diagnoses: Huntington disease and autism spectrum disorder (ASD) (including Asperger syndrome).
Figure 4.
Figure 4.
Example smoking annotations in electronic medical records. The boxes around selected words highlight those the HITEx system picked up as informative regarding smoking status. The second column provides the system's classification of the smoking status. This illustrates the challenges for which additional tuning was required. For example, the “tobac” in Lactobacillus is no less obvious to HITEx, initially, than the “tob” in “tob/alcohol.”
Figure 5.
Figure 5.
Costs of instrumenting the healthcare enterprise. Growth in costs of study as a function of number of subjects in a study is projected for different assumptions of the cost of sample acquisition, phenotyping, and genotyping. Eight lines are drawn corresponding to eight combinations of these three costs. The main diagram shows the projection for up to 20,000 subjects and the inset for up to one million. The costs for sample acquisition using i2b2 sample acquisition are $20 (LS) or $50 per sample for a larger population (HS) vs. the current cost (CS) of $650. The current costs for reviewing one record to phenotype a patient (CP1) or, more typically, five records reviewed per study patient identified (CP2) are estimated at $20/sample and $100/sample, respectively. High-throughput phenotyping through NLP (iP) is conservatively estimated at $50,000 per study. Current cost of genome-scale genotyping (CG) vs. lower cost genotyping (LG) within three years is estimated at $500 vs. $100, respectively. There is a range of about one-half order of magnitude cost reduction from having the phenotyping and sample acquisition done using i2b2 and another order of magnitude using genotyping costs projected for no more than three years from now. This is a difference, for a million-subject study, that covers a range from $1.2 billion to $150 million. These estimates are conservative, as none of the models considered provide for any improved efficiencies of scale.

References

    1. Allison JJ, Wall TC, Spettell CM, Calhoun J, Fargason CA, Jr, Kobylinski RW, Farmer R, Kiefe C. The art and science of chart review. Jt Comm J Qual Improv. 2000;26:115–136. - PubMed
    1. Buyske S, Yang G, Matise T, Gordon D. When a case is not a case: Effects of phenotype misclassification on power and sample size requirements for the transmission disequilibrium test with affected child trios. Hum Hered. 2009;67:287–292. - PubMed
    1. Catlin A, Cowan C, Hartman M, Heffler S. National health spending in 2006: A year of change for prescription drugs. Health Aff. 2008;27:14–29. - PubMed
    1. Clayton PD, Boebert WE, Defriese GH, Dowell SP, Fennell ML, Frawley KA, Glaser J, Kemmerer RA, Landwehr CE, Rindfleisch TC, et al. For the Record: Protecting Electronic Health Information. National Academy Press; Washington, DC: 1997.
    1. Committee on Quality of Health Care in America, Institute of Medicine. Crossing the Quality Chasm: A New Health System for the 21st Century. National Academy Press; Washington, DC: 2001.

Publication types

LinkOut - more resources