Multicenter Study
. 2009 Jul 15;302(3):261-75.
doi: 10.1001/jama.2009.997.

A network model of a cooperative genetic landscape in brain tumors

Affiliations
Multicenter Study

A network model of a cooperative genetic landscape in brain tumors

Markus Bredel et al. JAMA. .

Abstract

Context: Gliomas, particularly glioblastomas, are among the deadliest of human tumors. Gliomas emerge through the accumulation of recurrent chromosomal alterations, some of which target yet-to-be-discovered cancer genes. A persistent question concerns the biological basis for the coselection of these alterations during gliomagenesis.

Objectives: To describe a network model of a cooperative genetic landscape in gliomas and to evaluate its clinical relevance.

Design, setting, and patients: Multidimensional genomic profiles and clinical profiles of 501 patients with gliomas (45 tumors in an initial discovery set collected between 2001 and 2004 and 456 tumors in validation sets made public between 2006 and 2008) from multiple academic centers in the United States and The Cancer Genome Atlas Pilot Project (TCGA).

Main outcome measures: Identification of genes with coincident genetic alterations, correlated gene dosage and gene expression, and multiple functional interactions; association between those genes and patient survival.

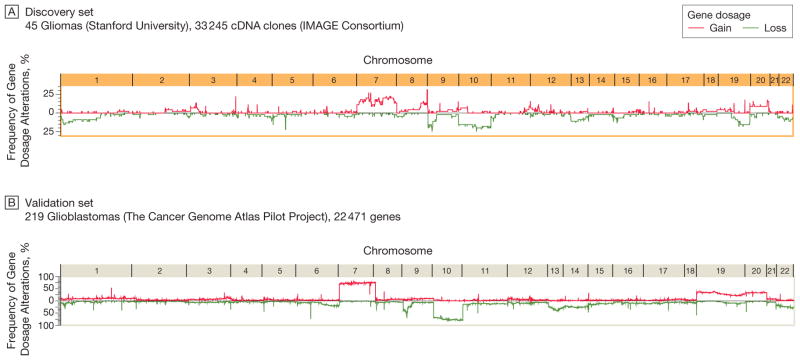
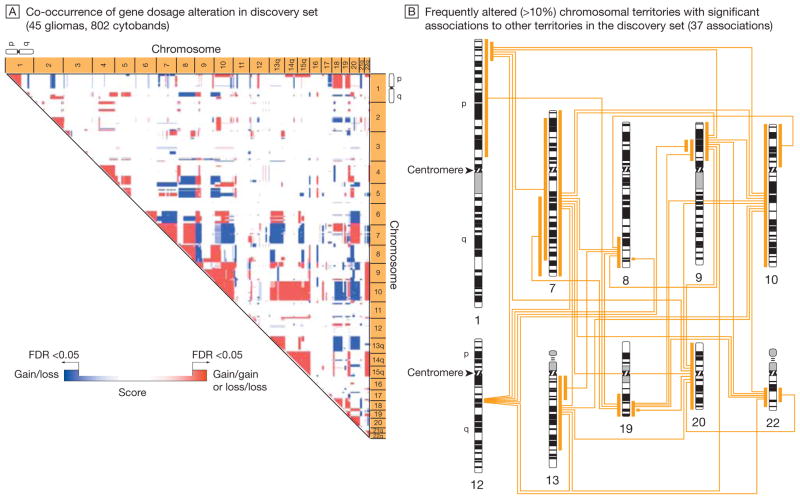
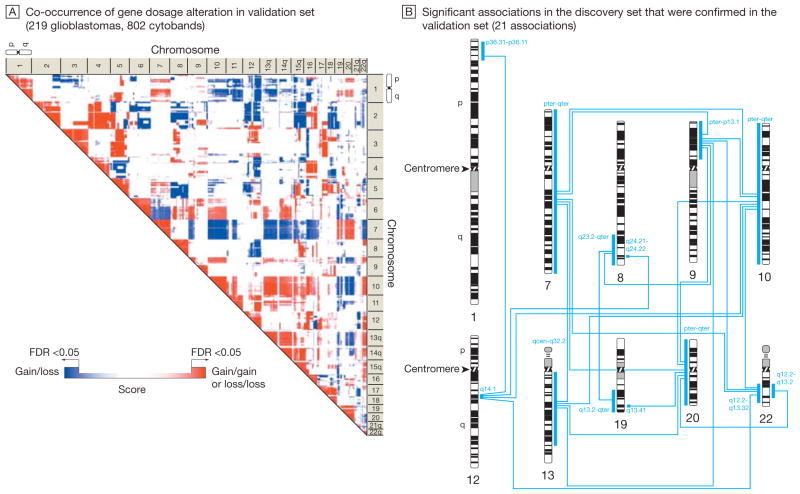
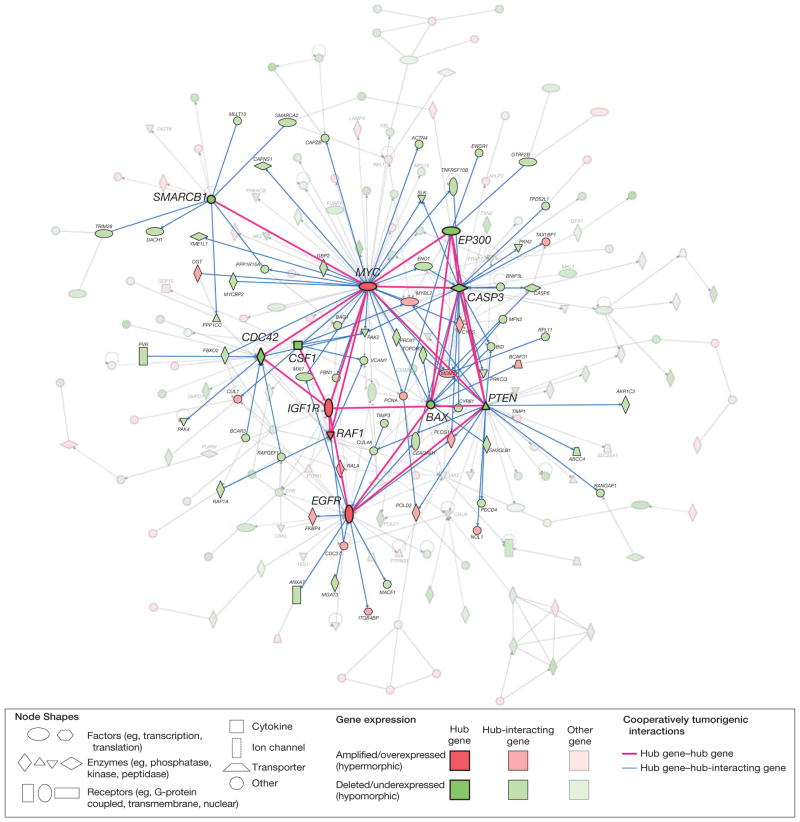
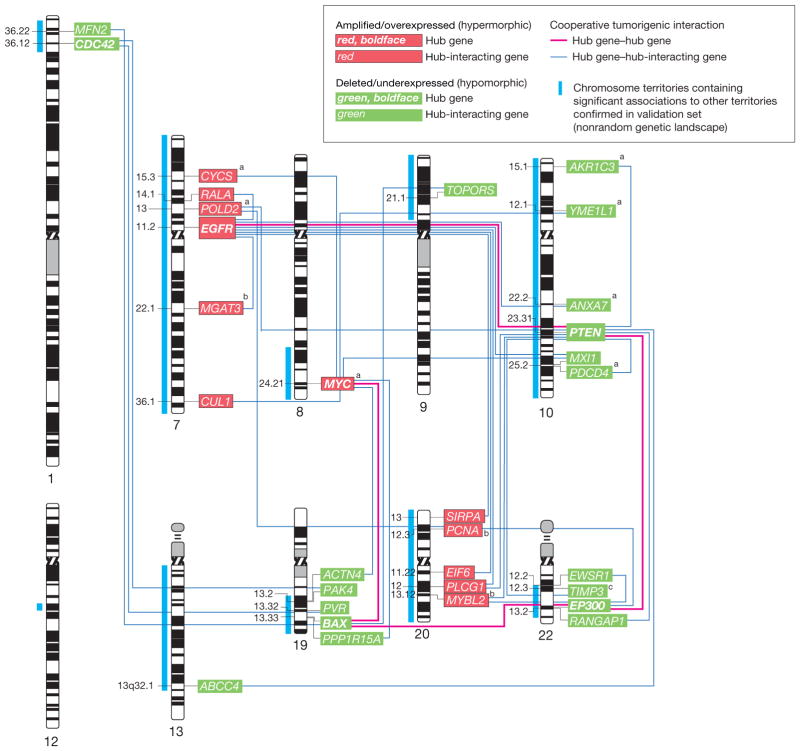
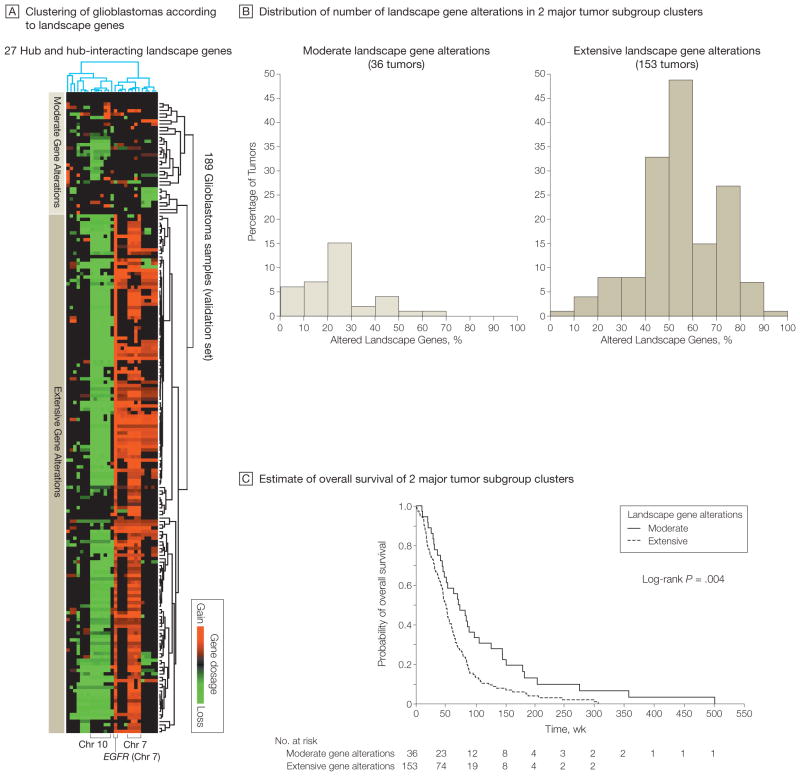
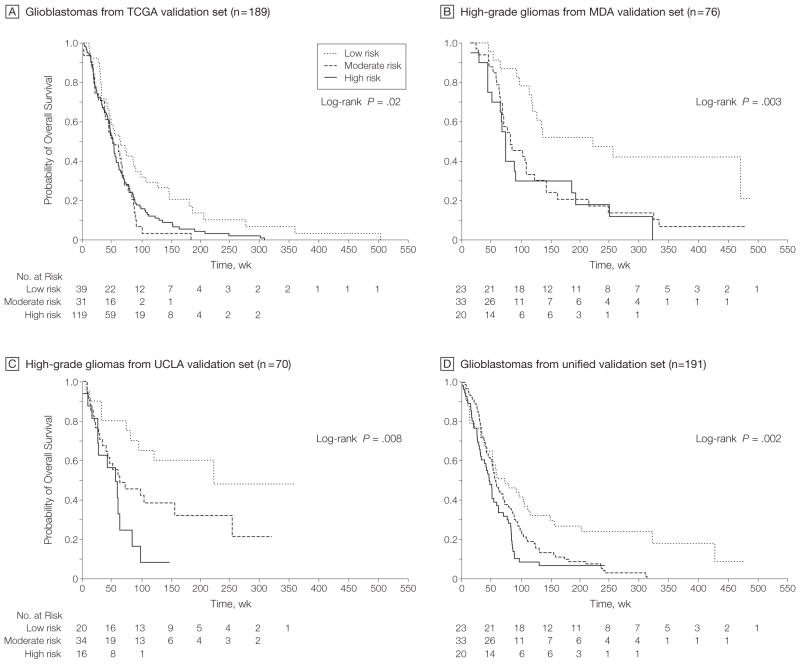
Results: Gliomas select for a nonrandom genetic landscape-a consistent pattern of chromosomal alterations-that involves altered regions ("territories") on chromosomes 1p, 7, 8q, 9p, 10, 12q, 13q, 19q, 20, and 22q (false-discovery rate-corrected P<.05). A network model shows that these territories harbor genes with putative synergistic, tumor-promoting relationships. The coalteration of the most interactive of these genes in glioblastoma is associated with unfavorable patient survival. A multigene risk scoring model based on 7 landscape genes (POLD2, CYCS, MYC, AKR1C3, YME1L1, ANXA7, and PDCD4) is associated with the duration of overall survival in 189 glioblastoma samples from TCGA (global log-rank P = .02 comparing 3 survival curves for patients with 0-2, 3-4, and 5-7 dosage-altered genes). Groups of patients with 0 to 2 (low-risk group) and 5 to 7 (high-risk group) dosage-altered genes experienced 49.24 and 79.56 deaths per 100 person-years (hazard ratio [HR], 1.63; 95% confidence interval [CI], 1.10-2.40; Cox regression model P = .02), respectively. These associations with survival are validated using gene expression data in 3 independent glioma studies, comprising 76 (global log-rank P = .003; 47.89 vs 15.13 deaths per 100 person-years for high risk vs low risk; Cox model HR, 3.04; 95% CI, 1.49-6.20; P = .002) and 70 (global log-rank P = .008; 83.43 vs 16.14 deaths per 100 person-years for high risk vs low risk; HR, 3.86; 95% CI, 1.59-9.35; P = .003) high-grade gliomas and 191 glioblastomas (global log-rank P = .002; 83.23 vs 34.16 deaths per 100 person-years for high risk vs low risk; HR, 2.27; 95% CI, 1.44-3.58; P<.001).

Conclusions: The alteration of multiple networking genes by recurrent chromosomal aberrations in gliomas deregulates critical signaling pathways through multiple, cooperative mechanisms. These mutations, which are likely due to nonrandom selection of a distinct genetic landscape during gliomagenesis, are associated with patient prognosis.


Figures

Figure 1
Figure 1
Gene Dosage Alterations Across the Glioma Genome Cartesian line diagrams depict the frequency of gene dosage alteration across a tumor population for genes mapped according to genome position along the chromosomes (X and Y chromosomes omitted). Gene dosage profiles were generated using circular binary segmentation change point analysis of microarray-based genomic hybridization profiles. Both the discovery and validation sets show consistently high frequencies of alterations involving chromosomes 1p, 7, 8q, 9p, 10, 12, 13, 19, 20, and 22. IMAGE indicates Integrated Molecular Analysis of Genomes and Their Expression Consortium.
Figure 2
Figure 2
Model of a Nonrandom Genetic Landscape in Gliomas: Discovery Set A permutation-based approach, which calculates the probabilistic fit for the coincidence of distinct chromosomal alterations, was applied to the gene dosage data in the discovery set from Stanford University. The gene dosage data generated by the circular binary segmentation change point algorithm were averaged according to 802 cytogenetic bands (cytobands)—subregions of a chromosome visible microscopically after special staining—that correspond to an International System for Human Cytogenetic Nomenclature (ISCN) 850 chromosome ideogram. The association map (A) indicates chromosomal regions (territories) with significant co-occurrence of gene dosage alteration (false-discovery rate [FDR]–corrected P<.05). Red scores denote the significant association of 2 chromosomal gains or 2 chromosomal losses; blue scores, the significant association of a gain and a loss event. The color gradation reflects a score that indicates the significance of cytoband-cytoband associations. The association map shows a consistent pattern of significant associations, which denotes a nonrandom genetic landscape in gliomas. B, Chromosomal territories that showed an alteration frequency of greater than 10% (involving chromosomes 1p, 7, 8q, 9p, 10, 12, 13, 19, 20, and 22) in the discovery set and their significant associations are mapped to a human ISCN-850 chromosome ideogram. (See interactive Figure 1 showing significant associations in the discovery and validation sets at http://www.jama.com.)
Figure 3
Figure 3
Model of a Nonrandom Genetic Landscape in Gliomas: Confirmation by Validation Set Permutation-based approach described in Figure 2 was applied to the validation set from The Cancer Genome Atlas Pilot Project (TCGA). The association map (A) indicates chromosomal regions (territories) with significant co-occurrence of gene dosage alteration (false-discovery rate [FDR]–corrected P<.05). Red scores denote the significant association of 2 chromosomal gains or 2 chromosomal losses; blue scores, the significant association of a gain and a loss event. The color gradation reflects a score that indicates the significance of cytoband-cytoband associations. The association map shows a consistent pattern of significant associations, which denotes a nonrandom genetic landscape in gliomas. B, Significant associations identified in the discovery set (Figure 2B) that were confirmed in the TCGA validation set. The blue bars and corresponding blue labels indicate chromosome territories with TCGA-confirmed significant associations to other territories (TCGA-validated nonrandom genetic landscape). (See interactive Figure 1 showing significant associations in the discovery and validation sets at http://www.jama.com.)
Figure 4
Figure 4
Complex Network of Glioma Gene Interactions Highlighting Hub Gene–Hub Gene and Hub Gene–Hub-Interacting Gene Interactions Graphical representation of the interactions and networking of 214 glioma genes. The 214 genes represent the subset of all 1562 genes with significant gene dosage–transcript relationships (false-discovery rate–adjusted q<.10) that map to the top-scoring subnetworks identified in a network modeling approach using Ingenuity Pathway Analysis. These subnetworks were merged using a force-directed layout algorithm to form a composite network representing the underlying biology of the process. Genes are represented as nodes using various shapes that represent the functional class of the gene product. The interactions of genes with tumor-related biological functions and fulfilling the criterion of a network hub (11 genes) or interacting with hub genes (hub-interacting gene; 92 genes) are highlighted. Hub gene refers to a gene that shows a number of interactions with other genes (the hub-interacting genes or other hub genes) that is above the 95% quantile of the overall distribution of the number of interactions of all genes in the network (eFigure 5A). Cooperatively tumorigenic interactions are interactions for which integration of the mode of interaction for a hub-hub (solid red lines) or hub–hub-interacting gene pair (blue lines) with the direction of gene dosage–gene expression change (gain or loss) reveals an effect on this interaction that synergistically promotes tumorigenesis. Paired t testing comparing the number of cooperative vs noncooperative interactions for 11 hub genes with each other and 92 hub-interacting genes with tumor-related functions reveals a significant prevalence (P=.003) of cooperatively tumorigenic interactions (125 [71.8%] of all 174 interactions) (eFigure 4). (See interactive Figure 2 of the complete network at http://www.jama.com.)
Figure 5
Figure 5
Networking of 31 Hub and Hub-Interacting Genes With Cooperatively Tumorigenic Relationships That Map to the TCGA Validated Landscape Human chromosome ideogram representation of the networking of 31 hub and hub-interacting genes that map to The Cancer Genome Atlas Pilot Project (TCGA)–validated genetic landscape and possess cooperatively tumorigenic relationships. These cooperatively tumorigenic relationships emerge through the mode of interaction between the genes and their significant coalteration. Gene dosage–gene expression integration for 30 of the 31 genes with combined availability of gene dosage and expression data in TCGA confirmed significant gene dosage effects on transcription for 27 (90.0%) of 30 genes (Benjamini-Hochberg false-discovery rate–corrected P<.05). Labels indicate the cytogenetic band mapping of the genes. aGenes with a significant (P<.05) relationship between gene dosage and duration of patient survival in the TCGA data set based on Cox proportional hazards regression analysis. bGenes without confirmed significant gene dosage–gene expression relationship in the TCGA data set. cTIMP3 is embedded within an intron of the SYN3 gene. Gene dosage information for TIMP3 was only indirectly available through a probe mapping to SYN3 in TCGA. Integration of gene dosage information using this probe and TIMP3 transcript information revealed a significant (P<.05) gene dosage–transcript relationship.
Figure 6
Figure 6
Subgroups of Glioblastomas With Distinct Landscape Gene Profiles Associated With Patient Survival A, Unsupervised hierarchical clustering (2-way complete linkage clustering based on Pearson correlation as the distance metric) of 189 of 219 glioblastomas from The Cancer Genome Atlas Pilot Project (TCGA) (with availability of corresponding survival data) according to the 27 landscape genes in Figure 5 with a TCGA-validated gene dosage–expression relationship. Rows on heat map represent patient samples; columns represent the 27 genes. Two major tumor clusters with distinct gene dosage alteration patterns were identified (moderate and extensive). Supervised group predictor analysis revealed highest group-predictive power for altered genes on chromosomes 7 and 10. B, Distribution of the number of landscape gene alterations among the 2 major clustering subgroups identified by the hierarchical clustering in panel A. The groups show a significant difference in mean number of landscape gene alterations (P<.001 by unpaired t test). C, Kaplan-Meier estimates of overall survival of the 2 major clustering subgroups indicated in panels A and B. Median follow-up was 73.1 (range, 10.6–503.4) weeks for the group with modest alterations and 47.0 (range, 1.1–307.4) weeks for the group with extensive alterations.
Figure 7
Figure 7
Multigene Risk Scoring Model in Malignant Gliomas Patient assignment to low-, moderate-, and high-risk groups is based on risk scores generated by the number of gene dosage alterations (0–2, 3–4, and 5–7, respectively) of 7 landscape genes (POLD2, CYCS, MYC, AKR1C3, YME1L1, ANXA7, and PDCD4), each of which was individually linked to patient survival in Cox proportional hazard regression analyses in The Cancer Genome Atlas Pilot Project (TCGA). A, Kaplan-Meier estimates of overall survival for the 3 groups in 189 glioblastomas from TCGA) with available survival data. Median follow-up for the low-, moderate-, and high-risk groups was 62.9 (range, 10.6–503.4), 49.3 (range, 2.4–307.4), and 51.0 (range, 1.1–183.1) weeks, respectively. B, Estimates of overall survival in the University of Texas M. D. Anderson Cancer Center (MDA) validation set of 76 high-grade gliomas. Median follow-up for the low-, moderate-, and high-risk groups was 175 (range, 33–477) weeks, 70 (range, 12–467) weeks, and 62 (range, 3–311) weeks, respectively. C, Estimates of overall survival in the University of California, Los Angeles (UCLA) validation set of 70 high-grade gliomas. Median follow-up for the low-, moderate-, and high-risk groups was 128.5 (range, 6–359) weeks, 58.5 (range, 8–320) weeks, and 49 (range, 1–147) weeks, respectively. D, Estimates of overall survival in the unified validation set of 191 glioblastomas. Median follow-up for the low-, moderate-, and high-risk groups was 73 (range, 1–479), 57.5 (range, 8–313), and 47 (range, 1–242) weeks, respectively.

Comment in

References

    1. Wen PY, Kesari S. Malignant gliomas in adults. N Engl J Med. 2008;359(5):492–507. - PubMed
    1. Cancer Genome Atlas Research Network. Comprehensive genomic characterization defines human glioblastoma genes and core pathways. Nature. 2008;455(7216):1061–1068. - PMC - PubMed
    1. Parsons DW, Jones S, Zhang X, et al. An integrated genomic analysis of human glioblastoma multiforme. Science. 2008;321(5897):1807–1812. - PMC - PubMed
    1. Bredel M, Bredel C, Juric D, et al. High-resolution genome-wide mapping of genetic alterations in human glial brain tumors. Cancer Res. 2005;65(10):4088–4096. - PubMed
    1. Nigro JM, Misra A, Zhang L, et al. Integrated array-comparative genomic hybridization and expression array profiles identify clinically relevant molecular subtypes of glioblastoma. Cancer Res. 2005;65(5):1678–1686. - PubMed

Publication types

MeSH terms