. 2009 Jul 15;4(7):e6261.
doi: 10.1371/journal.pone.0006261.

Top-down lipidomics reveals ether lipid deficiency in blood plasma of hypertensive patients

Affiliations

Top-down lipidomics reveals ether lipid deficiency in blood plasma of hypertensive patients

Juergen Graessler et al. PLoS One. .

Abstract

Background: Dyslipoproteinemia, obesity and insulin resistance are integrative constituents of the metabolic syndrome and are major risk factors for hypertension. The objective of this study was to determine whether hypertension specifically affects the plasma lipidome independently and differently from the effects induced by obesity and insulin resistance.

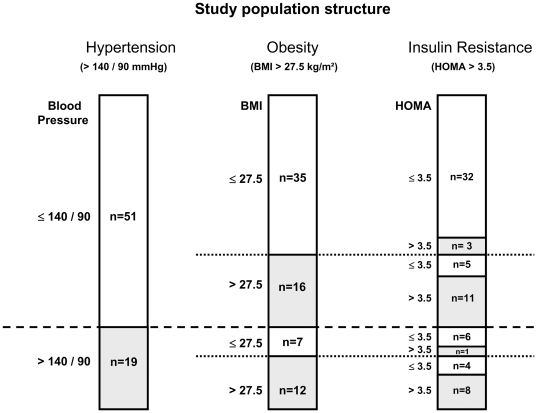
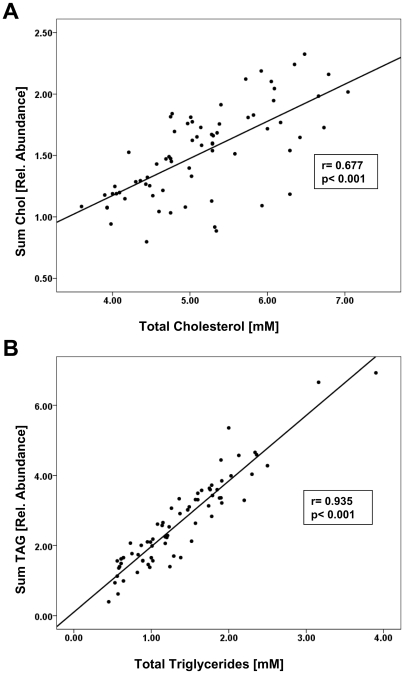
Methodology/principal findings: We screened the plasma lipidome of 19 men with hypertension and 51 normotensive male controls by top-down shotgun profiling on a LTQ Orbitrap hybrid mass spectrometer. The analysis encompassed 95 lipid species of 10 major lipid classes. Obesity resulted in generally higher lipid load in blood plasma, while the content of tri- and diacylglycerols increased dramatically. Insulin resistance, defined by HOMA-IR >3.5 and controlled for BMI, had little effect on the plasma lipidome. Importantly, we observed that in blood plasma of hypertensive individuals the overall content of ether lipids decreased. Ether phosphatidylcholines and ether phosphatidylethanolamines, that comprise arachidonic (20:4) and docosapentaenoic (22:5) fatty acid moieties, were specifically diminished. The content of free cholesterol also decreased, although conventional clinical lipid homeostasis indices remained unaffected.

Conclusions/significance: Top-down shotgun lipidomics demonstrated that hypertension is accompanied by specific reduction of the content of ether lipids and free cholesterol that occurred independently of lipidomic alterations induced by obesity and insulin resistance. These results may form the basis for novel preventive and dietary strategies alleviating the severity of hypertension.


Conflict of interest statement

Competing Interests: The authors have declared that no competing interests exist.

Figures

Figure 1
Figure 1. The study population.
The structure of patient cohort is presented with respect to hypertension, obesity and insulin resistance. Bars represent the total number of patients (n = 70); horizontal dotted lines stand for the thresholds for blood pressure, BMI and HOMA-IR, respectively. Numbers within each bar indicate the number of patients within each of the sub-groups having the corresponding indices above or below the thresholds. For example, among hypertensive patients (n = 19; the bar at the left hand side), 7 were not obese (BMI<27.5 kg/m2; the bar in the middle) and 6 of those showed normal insulin resistance (HOMA-IR <3.5; the bar at the right hand side).
Figure 2
Figure 2. The workflow for top-down shogun lipidomic screens.
A) EDTA plasma samples of 70 men (age of 22–79) was collected and lipids were extracted by methyl-tert-bytyl ether. Total extracts reconstituted in CHCl3/MeOH/2-propanol 1/2/4 (v/v/v) mixture, containing 7.5 mM ammonium acetate were directly infused into a LTQ Orbitrap mass spectrometer and high resolution mass spectra were acquired. 151 mass spectra were analyzed using LipidX software, which identified and quantified individual lipids. B) Representative high resolution mass spectrum of a total lipid extract of blood plasma. Spectra acquisition time was 3 min, while full sample analysis time was less than 4 min. Most abundant peaks are annotated with m/z; shaded areas designate m/z ranges in which corresponding lipid classes were detected. Major background peaks are designated with asterisks.
Figure 3
Figure 3. Quantification by top-down lipidomics correlates with clinical indices.
A) Linear regression analysis of the total cholesterol content determined by mass spectrometry and by clinical chemistry analysis. Mass spectrometry quantified total cholesterol content by summing up the abundances of free cholesterol, all cholesteryl esters and their common fragment ion at m/z 369.35. B) Linear regression of the total triglyceride content determined by mass spectrometry and by clinical chemistry analysis. Mass spectrometry quantified the total TAG content by summing up all the abundances of individual TAG species. In both panels each dot represents the total extract of individual plasma sample.
Figure 4
Figure 4. The effect of BMI increase on plasma lipidome.
Changes in plasma lipidome of men with BMI >27.5 kg/m2 (n = 28) relative to a control group of men with BMI≤27.5 kg/m2 (n = 42), as determined by clinical indices (panel A) and by top-down shotgun mass spectrometry (panel B). In B relative % was determined for each species individually, irrespective of its absolute abundance. In the diagram, within each lipid class, species were sorted according to their absolute abundance from top to bottom in descending order. For example, among the TAG class the species TAG [52∶2] was the most abundant, while TAG [49∶2] was the least abundant. Data are presented as mean. Statistical analysis was performed by univariate analysis of variance.
Figure 5
Figure 5. The effect of insulin resistance on plasma lipidome.
Changes in plasma lipidome of men with HOMA-IR >3.5 (n = 23), relative to a control group of men with HOMA-IR≤3.5 (n = 47), as determined by clinical chemistry indices (panel A) and by top-down shotgun mass spectrometry (panel B). Statistical analysis by univariate analyses of variance with mean data controlled for BMI (ANCOVA) as described in Materials and Methods section.
Figure 6
Figure 6. The effect of hypertension on plasma lipidome.
Changes in plasma lipidome of men with hypertension (n = 19), relative to a control group of men without hypertension (n = 51), as determined by clinical indices (panel A) and by top-down shotgun mass spectrometry (panel B). Statistical analyses by univariate analyses of variance with mean data controlled for BMI and HOMA-IR (ANCOVA) as described in Material- and Methods section.
Figure 7
Figure 7. The effect of hypertension on selected species in the blood plasma lipidome.
Box plots diagrams of plasma concentrations of free cholesterol, PC-O [36∶4], PC-O [38∶4], PE-O [38∶5], PE-O [38∶6], and PE-O [40∶5] in a group of men with hypertension (n = 19) and a control group of men without hypertension (n = 51) determined by top-down shotgun mass spectrometry. Statistical analyses by univariate analyses of variance. * p≤0.05, ** p≤0.01.

References

    1. Castelli WP, Anderson K. A population at risk. Prevalence of high cholesterol levels in hypertensive patients in the Framingham Study. Am J Med. 1986;80:23–32. - PubMed
    1. Neutel JM, Smith DH. Hypertension: where have we gone wrong and how can we fix it? Am J Hypertens. 1998;11:150S–157S. - PubMed
    1. Reaven GM. Relationship between insulin resistance and hypertension. Diabetes Care. 1991;14(Suppl 4):33–38. - PubMed
    1. Bo S, Gambino R, Gentile L, Pagano G, Rosato R, et al. High-normal blood pressure is associated with a cluster of cardiovascular and metabolic risk factors: a population-based study. J Hypertens. 2009;27:102–108. - PubMed
    1. Nguyen NT, Magno CP, Lane KT, Hinojosa MW, Lane JS. Association of hypertension, diabetes, dyslipidemia, and metabolic syndrome with obesity: findings from the National Health and Nutrition Examination Survey, 1999 to 2004. J Am Coll Surg. 2008;207:928–934. - PubMed

Publication types