. 2009 Jul;126(1):243-53.
doi: 10.1121/1.3129129.

Finite element modeling of sound transmission with perforations of tympanic membrane

Affiliations

Finite element modeling of sound transmission with perforations of tympanic membrane

Rong Z Gan et al. J Acoust Soc Am. 2009 Jul.

Abstract

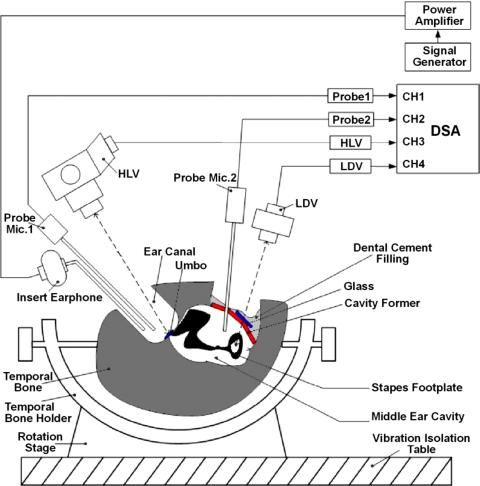
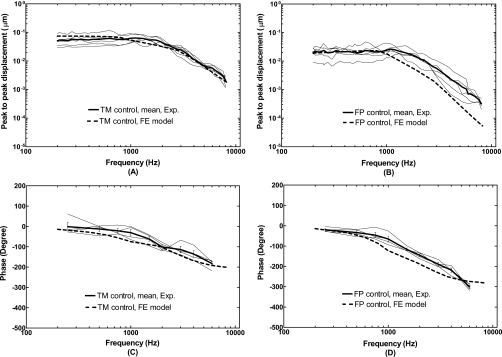
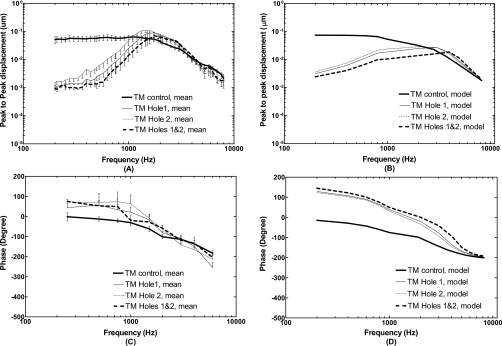
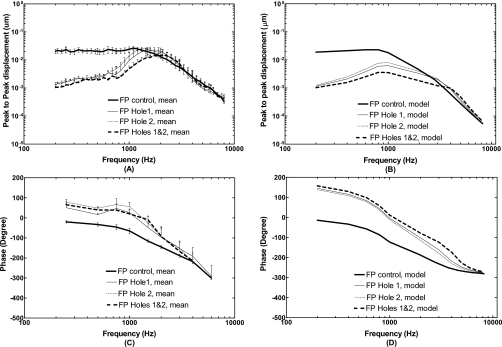
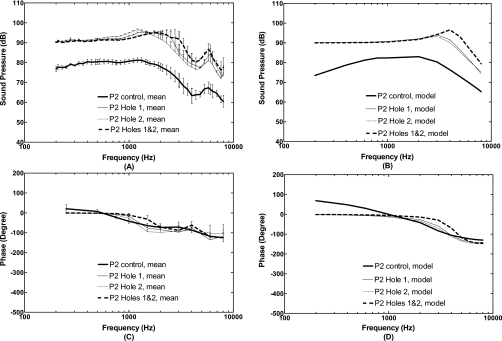
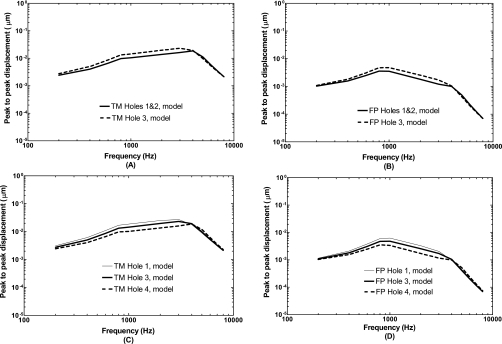
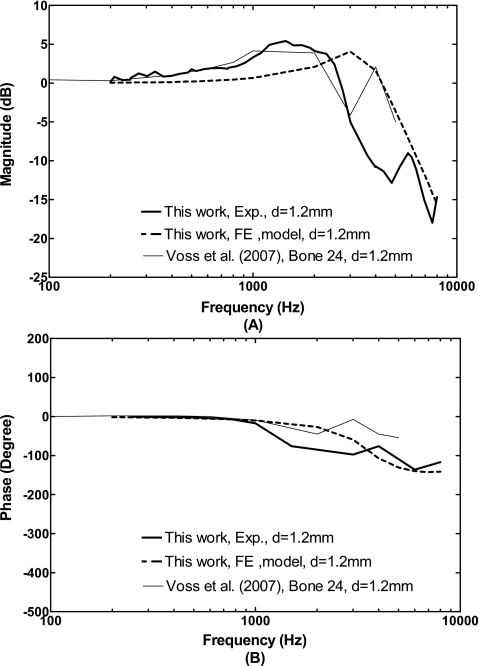
A three-dimensional finite element (FE) model of human ear with structures of the external ear canal, middle ear, and cochlea has been developed recently. In this paper, the FE model was used to predict the effect of tympanic membrane (TM) perforations on sound transmission through the middle ear. Two perforations were made in the posterior-inferior quadrant and inferior site of the TM in the model with areas of 1.33 and 0.82 mm(2), respectively. These perforations were also created in human temporal bones with the same size and location. The vibrations of the TM (umbo) and stapes footplate were calculated from the model and measured from the temporal bones using laser Doppler vibrometers. The sound pressure in the middle ear cavity was derived from the model and measured from the bones. The results demonstrate that the TM perforations can be simulated in the FE model with geometrical visualization. The FE model provides reasonable predictions on effects of perforation size and location on middle ear transfer function. The middle ear structure-function relationship can be revealed with multi-field coupled FE analysis.


Figures

Figure 1
Figure 1
FE model of human left ear including the external ear canal, the middle ear [TM three ossicles (malleus, incus, and stapes), two joints and manubrium, ligaments and muscle tendons, tympanic annulus, stapedial annular ligament, and middle ear cavity], and the uncoiled cochlea in anterior-medial view. The middle ear cavity and cochlear chambers were assumed transparent. Here, C1, C2, C3, C4, C5, and C7 stand for the superior mallear ligament, lateral mallear ligament, posterior incus ligament, anterior mallear ligament, stapedial tendon, and tensor tympani tendon, respectively.
Figure 2
Figure 2
Lateral view of the TM with perforations. The sizes of perforations are given in the text. (A) Two perforations: Hole 1—the perforation located in the posterior-inferior quadrant of the TM; Hole 2—the perforation located in the inferior part. (B) Single perforation Hole 3 in the posterior-inferior site. (C) Single perforation Hole 4 in the posterior-inferior site.
Figure 3
Figure 3
Schematic diagram of the experimental setup in human temporal bone with two laser vibrometers for measuring vibrations at the TM (umbo) and stapes footplate simultaneously. Two probe microphones were used for monitoring sound pressures in the ear canal and middle ear cavity.
Figure 4
Figure 4
Comparison of the FE model-derived TM (at the umbo) displacement and stapes footplate displacement with the measurements from five human temporal bones with intact TM’s in magnitude and phase angle. The input sound pressure level was 90 dB at 2 mm from the umbo in the ear canal. The thick broken lines represent the model results. The thin solid lines represent the curves obtained from the individual temporal bones with the mean curves (thick solid lines). [(A) and (C)] TM displacement; [(B) and (D)] footplate displacement.
Figure 5
Figure 5
Mean displacements with standard errors (N=5) measured at the TM (umbo) and calculated from the FE model in control or intact TM (thick solid lines), perforations Hole 1 (thin solid lines), Hole 2 (thin dashed lines), and combined Holes 1 and 2 (thick broken lines). The input sound pressure level was 90 dB at 2 mm from the umbo in the ear canal. [(A) and (C)] Bone experiments; [(B) and (D)] FE model.
Figure 6
Figure 6
Mean displacements with standard errors (N=5) measured at the stapes footplate and calculated from the FE model in control or intact TM (thick solid lines), perforations Hole 1 (thin solid lines), Hole 2 (thin dashed lines), and combined Holes 1 and 2 (thick broken lines). The input sound pressure level was 90 dB at 2 mm from the umbo in the ear canal. [(A) and (C)] Bone experiments; [(B) and (D)] FE model.
Figure 7
Figure 7
Mean sound pressure level in the middle ear cavity (P2) with standard errors measured from five temporal bones and calculated from the FE model in control or intact TM (thick solid lines), perforations Hole 1 (thin solid lines), Hole 2 (thin dashed lines), and combined Holes 1 and 2 (thick broken lines). The input sound pressure P1 was 90 dB at 2 mm from the umbo in the ear canal. [(A) and (C)] Bone experiments; [(B) and (D)] FE model.
Figure 8
Figure 8
Comparison of the effects of perforation size and location on TM (umbo) and footplate displacements. (A) TM displacements obtained from two holes (Hole 1 and Hole 2) and a single Hole 3 with the same perforation area. (B) Footplate displacements obtained from two holes (Hole 1 and Hole 2) and a single Hole 3. (C) TM displacement obtained from single hole with different sizes. (D) Footplate displacement obtained from single hole with different sizes.
Figure 9
Figure 9
The ratio of middle ear cavity pressure P2 to pressure in the ear canal P1, or middle ear cavity pressure transfer function P2∕P1, measured from temporal bones and calculated from the FE model with perforations in comparison with the results reported by Voss et al. (2007). (A) Magnitude; (B) phase angle.

References

    1. Aibara, R., Welsh, J. T., Puria, S., and Goode, R. L. (2001). “Human middle-ear sound transfer function and cochlear impedance,” Hear. Res. HERED3 152, 100–109.10.1016/S0378-5955(00)00240-9 - DOI - PubMed
    1. Ahmad, S. W., and Ramani, G. V. (1979). “Hearing loss in perforations of the tympanic membrane,” J. Laryngol. Otol. JLOTAX 93, 1091–1098.10.1017/S0022215100088162 - DOI - PubMed
    1. Bigelow, D. C., Swanson, P. B., and Saunders, J. M. (1996). “The effect of tympanic membrane perforation size on umbo velocity in the rat,” Laryngoscope LARYA8 106, 71–76.10.1097/00005537-199601000-00014 - DOI - PubMed
    1. Funnell, W. R. J., and Laszlo, C. A. (1978). “Modeling of the cat eardrum as a thin shell using the finite-element method,” J. Acoust. Soc. Am. JASMAN 63, 1461–1467.10.1121/1.381892 - DOI - PubMed
    1. Gan, R. Z., and Wang, X. (2007). “Multi-field finite element analysis for sound transmission in otitis with effusion,” J. Acoust. Soc. Am. JASMAN 122, 3527–3538.10.1121/1.2793699 - DOI - PubMed

Publication types